Wednesday, December 29, 2010

Investing in the Neutral Zone

I remember the old Star Trek episodes that began with distress calls from some poor spaceship stuck in the Neutral Zone, a vast negotiated area of neutral space designed to separate the Federation of Planets (the good guys) from the Klingons or the Romulans (the bad guys). For the most part, things never went well for the good guys stuck in the Neutral Zone. Captain Kirk, Mr. Spock, and the rest of the Star Trek crew had to fight their way out of many cunningly devised traps set for them by the Klingons and the Romulans in order to get back to safety.

It seems to me that for the past 18 months Pinnacle has also been stuck in the Neutral Zone. For us, the neutral zone is investing diversified portfolios so that they have the same volatility as our investment benchmarks. On a practical level, “neutral” means we haven’t taken a long or short position in risk assets relative to the benchmark. When we are in the neutral zone our incremental approach to changing portfolio asset allocation becomes even more…well….incremental. Small changes in asset class weightings take up a disproportionate amount of time relative to the size of the trades. The timing of even the smallest transactions becomes of paramount concern in the Neutral Zone because the smallest amount of gain or loss due to timing concerns can make huge differences in relative, if not absolute, returns. The importance of investment selection is also magnified when we are neutral to our benchmarks for similar reasons. When our analysts do not make a large relative bet regarding portfolio risk, then all of the nuances of portfolio construction and management become magnified. When you are stuck in the Neutral Zone, owning cash at 0% interest is a major concern. Eclectic managers who underperform for relatively short time periods also become a major concern.

The two worst enemies in the Pinnacle neutral zone are 1) a loss of perspective as analysts become overly focused on incremental decisions, and 2) problems with correlations. Yes, once again I’m carrying on about how asset class correlation can play havoc with short-term portfolio risk and reward assumptions. In the neutral zone any and all of the alternative investments in the portfolio can betray you because by definition their performance can zig and zag differently from the benchmark asset classes at any time. If you are trying to beat a relative benchmark, I suggest you hope for an encounter with Klingons or Romulans, because if you are unfortunate enough to run into peak correlations in the Neutral Zone, your chances of survival are limited.

Monday, December 27, 2010

China Plays the Role of Grinch

On Christmas Day, as investors in Whoville were away from their Bloomberg terminals celebrating with family and friends, China did their best Grinch impression and surprised markets by raising interest rates a quarter point in response to surging inflation. They raised their 1-year lending to 5.81%, while the 1-year deposit rate was increased to 2.75%. They’ve also been hiking reserve requirements for banks in an effort to cool their red-hot economy.

The interest rate action knocked Chinese stocks down by -2% today. There’s been a notable divergence developing between Chinese and U.S. equities over the past several weeks, with the FXI China ETF off -1.3% so far this month while the S&P 500 is up 6.6%.

With inflation rising above 5% in November, odds are that China will feel the need to continue to tighten going into 2011. The possibility of them overdoing it is certainly one of the bigger risks facing the global economy, since China has been considered the main engine of growth in the current environment. Achieving the proverbial “soft landing” has proven to be a difficult feat over the years. We'll be watching closely to see if they can pull it off.

Chart: China 1-year deposit rate

Thursday, December 23, 2010

Letter to Santa

Dear Santa,

I know I’m sending this from my work address and your organization usually only serves the consumer market, but our analysts here at Pinnacle have worked very, very hard this year and have been very good. If it’s OK I thought I would ask your elves to make a few special gifts for us this year, over and above the toys and cookies in your sleigh. I don’t mean this to sound the wrong way Santa, but the first thing on our Christmas list this year is world peace and good will towards men. I know you get asked this all of the time, but I figure at $55 of normalized earnings for the S&P 500 Index, world peace has to be worth a multiple of 50 times earnings which means the stock market would rally to 2,750, a gain of about 120% from today’s prices. I just saw Miracle on 34th Street for the fourth time this year (I love that movie, Santa) and I know how hard it was to get the little girl a new home and a daddy, so maybe world peace is a little stretch for this year….but I thought I would ask.

The next think we want for Christmas is low correlations, Santa. I don’t know if your elves can build low correlations in their workshop with such short notice before Christmas and it occurs to me they might not know what low correlations are. Correlations measure how the asset classes in our portfolio move versus one another, and when correlations are low asset classes zig and zag at different times and that reduces the volatility of our portfolios. You see, Santa, if we know correlations will stay low than it’s easier for us to add risk assets to our portfolios so that we can make our clients more money in this bull market. They’ve been good boys and girls too, Santa (…I’m just sayin’), so if your elves are a little confused with this low correlation request please have them send me an email and I’ll explain it to them.

Our last Christmas gift would truly be miraculous, Santa. We would like all of the unemployed people in the US to get jobs and go back to work and be happy. At the same time, we wonder if your elves could kind of make Ben Bernanke, our Federal Reserve Chairman, not worry about this upsurge in employment. You see, Santa, if Ben Bernanke sees everyone go back to work then he is likely to raise interest rates and stop buying Agency and Treasury bonds in the open market. He might even begin selling some from the Fed’s balance sheet, and we know stock investors are going to be upset if the Fed begins to tighten their monetary policy. So please see if maybe your elves can do something about this as well.

It’s time to go, Santa. We are going to leave cookies and milk by the door of the Pit for you this year just in case you get our letter. We want to wish everyone a happy and safe holiday!

Wednesday, December 22, 2010

The Ghost of Lehman Past

Oh, it was a great day yesterday. We can breathe a sigh of relief because the S&P 500 hit its pre-Lehman bankruptcy level. Lehman Brothers filed for Chapter 11 on September 15th, 2007 and the S&P 500 high that day was 1250.92. Yesterday, the S&P 500 closed at 1254.60.

This level, as the market plummeted to its ultimate bear market low of 666 in 2009, was highlighted by many analysts as the launching point of fear. And although the price has now fully recovered, the fear in the system is still very much present. Ned Davis Research published a study of the Conference Board Consumer Confidence Index in their 2011 Outlook which shows that extreme pessimism still exists. Unemployment is still very high at 9.8%, necessities of life are inflating as income stagnates, housing is still searching for a bottom, and of course confidence has not returned. This is the most distrusted bull market for a reason.

But this leaves many questions about the future. Is the degree of pessimism warranted? Is this bull market built on smoke and mirrors which disintegrates when the liquidity is removed from the market? Or does Main Street pessimism even matter? Has the market discounted decent growth in 2011 which ignites a virtuous cycle? This is only the tip of the tip of the iceberg but a good place to start as we approach the New Year. Here’s to the Ghost of Portfolio Future.

Tuesday, December 21, 2010

Can’t Model the Art of Investing

At Pinnacle we are constantly reading investment views from some of the world’s smartest people. Recently I picked up a piece written by Howard Marks of Oaktree Capital called “All That Glitters.” The focus of the article was on gold, and it raised some great points to consider regarding the shiny metal and whether or not it’s a good investment at today’s prices. I wouldn’t be surprised if it shows up in a future issue of Advisor Perspectives, and I’d encourage anyone that has the time to read it if it does.

However, the passage from Mark's piece that prompted this blog was not about gold, but more a description of one of the arts of investing. The paragraph that I thought was articulated in brilliant fashion is below:

But it goes further. Especially in the short run, the superior investor may not be the one who's right about the merit of something, or even the one who's right about the consensus view of merit. Rather, the superior investor may be the one who's right about the judgments other people will make about the consensus view of merit.
Pinnacle is a company that follows business cycle data, technical market conditions, and valuation, and there is no doubt that the weight of the evidence in those areas helps shape our overall view. However, we also realize that investing is as much art as it is science. Many investors are still searching for a scientific approach to investing that leads itself to quantitative models, thinking that the unemotional data can never do them wrong. We don’t believe you can package what Marks is referencing into a model. For that you need informed intuition, and a good dose of common sense. If anyone has a model that can bottle good out of the box thinking let us know. We won’t hold our breath…

Monday, December 20, 2010

10.2% Prediction for U.S. Market Next Year

Last week someone showed me a USA Today article where they rounded up the usual suspects who weighed in with their 2011 market predictions. I don’t have the article in front of me but the Chief Investment Strategists for Blackrock, Goldman Sachs, and other massive institutional investors fearlessly jumped in with their predictions. What surprised me (I don’t know why this kind of thing should surprise me anymore) was the specificity of the forecasts. Many of them gave their predictions down to the level of tenths of a percent. The more I think of it, if you are willing to go out on a limb and say the Dow Jones Industrial Average is going to gain 10% next year, then why not make it 10.1%? The extra ten basis points makes your forecast more persuasive since it implies greater scientific rigor in coming up with the number. Many of the forecast numbers in the article were exact to the same levels of precision. All I can say is… good for them.

I am at a loss to know what happens at the end of a calendar quarter, and especially at year-end, that compels normally smart and professional investment strategists to behave this way. Surely there is nothing about turning the page on a calendar that has an impact on earnings, margins, employment rates, currencies, and so forth? If there is uncertainty about the future of financial markets, why should it clear up so suddenly for so many analysts at year end, just in time to make their annual forecasts for the next year? I’ve personally never experienced this phenomenon where the month of December suddenly allows for forecasting market performance down to the decimal level, but I want to be clear that I am open to the experience. For the next few weeks I will be making a conscious effort to allow lightening, in the form of scientifically precise knowledge of future events, to strike. If it does, I promise the readers of this blog that you will be the second to know. My associates on the Pinnacle investment team will of course be the first.

Unfortunately, I’m guessing that our forecast for 2011 will evolve during the year, as has our forecasts for all of the previous years we’ve been actively managing portfolios. The main drivers of portfolio performance will be the strength of the US economic recovery, the problems in Europe, and the policy response to outsized growth in China. How these themes will play out during the year is difficult to forecast at the moment. During those times when the forecast is cloudy and the crystal ball isn’t overly clear, we tend to stick to widely diversified portfolios that are invested in a variety of different investment themes. BORING! I guess that’s why I’m unlikely to get a phone call any time soon from USA Today asking for Pinnacle’s 2011 forecast. They wouldn’t appreciate my answer that I’m 47.6% uncertain about the next twelve months of financial market behavior.

Friday, December 17, 2010

Divergence Developing in Volatility

At Pinnacle we tend to view volatility extremes as a contra-indicator for financial markets, with very low volatility associated with complacency and very high volatility associated with fear. Reaching such extremes can present very compelling investment opportunities at times. Currently, there is a big divergence in volatility measures between the stock and bond markets.

We are watching complacency build in equity markets as a measure of implied equity volatility (the VIX Index) has fallen near its low for the year, put/call options ratios are very low, and several surveys of investor bullishness or bearishness have grown exceedingly optimistic again.

The antithesis of the serene reading from the VIX can be seen in a measure of bond market volatility known as the MOVE Index. The MOVE Index is a measure of implied volatility in the Treasury market, and it has spiked to a new high for the year. This number also echoes recent bond surveys that imply that the short-term sentiment for bonds has turned in the opposite direction of stocks due to the wicked selloff in bonds, to deeply pessimistic levels.

Our sense is that the markets are setting up for a counter-trend rally that may feature a stock to bond rotation. The catch is that the counter-trend rally is not likely to end the bull market in stocks, nor is it likely to end the normalization of yields in the bond market. We are wrestling with what a counter-trend move might mean for portfolio allocations at this time.

Monday, December 13, 2010

Silly Season for Asset Allocation

I suppose it is that time of year for strategic, buy and hold, asset allocators to offer their best suggestions for the asset allocation that will, in their opinion, offer winning returns for the next decade. In a recent Wall Street Journal article, Burton Malkiel, one of the best known champions of passive investing, offered his suggestions in an article titled, “Buy and Hold is Still a Winner.” Malkiel proposes a portfolio that owns 33% fixed income, 27% U.S. equities, 28% international equities (one half of which is emerging markets) and 12% real estate trusts. Notably, Malkiel urges investors to own more international stocks as a percentage of their portfolio than U.S. stocks, an interesting thought process since international stock returns for U.S. investors are subject to significant currency risks.

This month BlackRock shared Byron Wein’s views on asset allocation in their December Commentary. Wein’s piece was titled, “A Radical Approach to Asset Allocation.” Indeed it is. The following is Wein’s recommended asset allocation for U.S. investors:

Here the big news is that traditional large cap global growth stocks only comprise 10% of Wein’s portfolio. Alternative investments like hedge funds, private equity, real estate, gold, and commodities make up 50% of the total. Emerging market equity at 20% and high yield fixed income at 20% comprise the rest of the portfolio. Clearly Mr. Wein is not bullish on the prospects for global corporations to grow their earnings.

To me, these asset allocations are interesting but not necessarily relevant to the question at hand. I want to know what circumstances would cause either pundit to change their allocation. If stocks lose 50% of their value would Wein still only rebalance to 10% of his portfolio? If real estate trusts double in value would Professor Malkiel still own 12% in these securities? Both Malkiel and Wein offer portfolio allocations that are rather predictable in light of the past decade’s awful U.S. equity performance. They both look in the rearview mirror to come up with an allocation that is presumed to have meaning to intelligent investors regardless of the facts and circumstances of future market environments. As far as I’m concerned, these allocations are relevant until they are not. When the facts and circumstances of the global economy change, these allocations should be changed as well. That’s what we call tactical asset allocation.

Friday, December 10, 2010

Stealth Climb

With tax legislation on the horizon and unemployment concerns lingering, it seems the minds of Americans are preoccupied. In the past, crude oil would have been on everyone’s mind as it crosses above the $90 per barrel level. Now, it’s hardly mentioned in the main stream media and rightly so as the other issues deserve more attention. But it will be interesting to see just how far the price of oil has to move until the country starts to take notice again. When will this stealth rise be known?

In the first chart below is the price of oil. Since the market bottom in August it has climbed 21% to hit $90 per barrel. At that rate, we will hit $100 oil by February. The second chart is the price of a gallon of regular gasoline. That price has already broken the cyclical high, and stands above $3 per gallon. If we hit $100 per barrel on crude, we could easily see $3.35 per gallon at the pump. This would certainly hurt consumers’ pocketbooks; maybe even enough to have us take notice.

Additionally, other commodities have posted staggering gains this year. Cotton is up 80%, wheat is up 20%, and sugar is up 40% to name a few soft assets, while gold is up over 20%. This asset class has been the beneficiary of Quantitative Easing policies in Developed nations and strong growth in Emerging nations, and is starting to stoke inflationary fears. With the recent fiscal and monetary policies enacted by our leaders asset inflation is expected to continue. I guess it is good the tax extensions will pass (if not this year then next session of Congress) so we can pay for the commodity inflation. Although now is the time to take notice before this negative feedback continues.

Thursday, December 9, 2010

Secular Bear and Cynical Bull

I would usually use the term “cyclical bull” or “cautious bull,” but this week a client tagged me with a new moniker, a “cynical bull.” To be fair, lately I’ve been describing two different ways you could be bullish and one of them I describe as being cynically bullish. Let me explain. It seems to me that lately you could be a “virtuous bull” or a cynical bull. Virtuous bulls see the stock market in the context of an expanding economy. While there are obviously structural problems with the U.S. and the global economy, the fact is that we ARE in an economic recovery that began last June. Most economic recoveries are built on a wall of worry where trailing economic indicators, namely employment statistics, take awhile to confirm the economic expansion. To be a virtuous bull means that you are expecting the “virtuous economic cycle” to find some traction. The virtuous cycle is the classic economic expansion where growing corporate profits leads to greater consumer confidence. Higher confidence leads to higher spending. Higher spending leads to increased employment as companies must hire new workers to meet increasing demand. All of which leads to higher sales and higher profits…and so the cycle continues. Given that we are only 1 and ½ years into an economic recovery, virtuous bulls see nothing but several years of economic growth (even if it’s less than average growth) and higher stock prices ahead.

Cynical bulls are an entirely different breed. They see the financial markets as being “rigged” where policymakers and large financial institutions are desperately trying to avoid a financial catastrophe. In the cynical world, big banks in cahoots with Central Bankers and politicians around the globe are changing the rules to flood the world economy with enough money to touch off significant asset inflation. This is one of the traditional methods of dealing with a debt crisis. By allowing assets to inflate you can bring debt to equity ratios in line without the bothersome problem of paying off debt. Cynics find great joy in economic policy designed to prevent deflation at any cost and jump with glee as the Federal Reserve obviously manipulates the U.S. currency while claiming, with a straight face, that they are actually only interested in stimulating the economy and creating jobs. Asset inflations are wonderful opportunities to make money if you are a cynical bull since we believe our job is find asset inflations wherever we can find them and make lots of money by investing in them.

Of course the trick of riding an asset inflation bubble is 1) finding them closer to the beginning of the bubble than the top of the bubble, and 2) selling them before they burst. Cynical bulls don’t really care about the distinction between a virtuous cycle and a cycle that is induced by stimulus programs that will be paid for by the next generation…or the Chinese. We just care that getting too far out of the market when the candle gets lit and policymakers start spending the money is a risky thing to do if you want to be in a market with generally rising prices. This week’s drama in Washington where it looks like we get income tax extensions, estate tax cuts, payroll tax holidays, unemployment insurance extensions, credits for small businesses, and much, much more, is just music to the ears of a cynical bull. The game is still afoot and there is probably still more life in this bull market as long as the money-producing spigot is still open.

Tuesday, December 7, 2010

Fiscal Package A Catalyst, But For What Market?

Today the markets are buzzing on a tentative fiscal package that could extend the Bush tax cuts, emergency unemployment benefits, and even reduce social security taxes that come directly out of workers’ pockets. On the surface, this appears to be a fresh fiscal injection of liquidity that should act to bolster economic growth and has a chance to keep animal spirits focused on the bullish case for risk assets over a cyclical horizon.

The bad news is that the proposed package will cost almost $1 trillion, and it certainly flies in the face of a true concerted effort to reduce our country’s debt load. It wasn’t too long ago something called the deficit commission essentially concluded our nation is on an unsustainable fiscal path. Throughout 2010 we have also been witnessing a return of the global bond vigilantes. One of the lessons of this year might be that too much debt will ultimately force bond market adjustments, and those adjustments can ripple quickly through financial markets.

The proposed tax package is not a done deal, and Democrats are already voicing some major displeasure with the proposal. Assuming it gets passed without material changes, it seems destined to be a catalyst. But, will it be a positive catalyst for rising risk asset prices, or a negative one that causes a return of the U.S. bond vigilantes? That distinction could be the difference between another big leg up, or marginal new highs that succumb to a riot in the bond market.

Monday, December 6, 2010

Like Kissing Your Sister

Sometimes great minds think alike in the investment team, and I see that this blog overlaps the excellent piece on recent market performance that Carl posted on Friday. Nevertheless, here are a few additional thoughts on the topic.

The S&P 500 Index finished trading last Friday at a closing price of 1225. This is the same price the Index closed on 11/05/10, and it is +1.6% ahead of the close on 4/23/10, a period of close to eight months where stock investors have been disappointed. As I like to say, owning the broad market for the past eight months has been like “kissing your sister.” There just hasn’t been any thrill to being an equity investor when measured from the April market top. However, as Carl said last Friday, looking at the broad large-cap U.S. equity market doesn’t tell the whole story. For example, small-cap U.S. and mid-cap U.S. have both broken out to new highs as measured from the April peak (see chart on Carl’s blog). If you drill down into the S&P sectors and industries you find a number of fairly significant winners measured both from the April top and the November 5th top for the S&P 500 Index. Here are just a few sectors and industries that have performed well since April 23rd top and since 11/05/10. (Note: Pinnacle owns positions in all of these securities in various managed strategies.)

Gain Since 4/23/10

IGV Software ETF +13%

XOP Oil and Gas Exploration ETF +11%

IGN Networking ETF +7.1%

XLE Energy ETF +7%

XLY Consumer Discretionary ETF +5.6%

SPY S&P 500 Index ETF +1.6%

Lately we’ve been discussing the best strategy for buying this particular market. Should we view it suspiciously as the broad market has yet to convincingly break through important resistance that goes all the way back to late April? Or, should we be concentrating on individual sectors and industries that have already convincingly broken out to new highs and not worry about the broad market? Clearly tech, energy, and consumer stocks have resumed the bull market that began in March of 2009. In the past our investment process has focused on the broad market first. Presumably you could make the argument that waiting for the broad market to break out of its trading range is the more conservative methodology for risk averse investors. However, it may be that we have to switch gears here and begin to allow ourselves to invest more from the “bottom up,” meaning that we concentrate a little more on the sectors and industries. In a flat market like this, where gains might be fleeting, we may have to let the underlying sector performance guide our thinking more than it has in the past.

Friday, December 3, 2010

Breakouts

The stock market has had a very cheery start to December, which is typically the best month of the year. In just the first two trading days, the S&P 500 is already ahead by 3.5%. With all of the negative headlines swirling about the continuing debt problems in Europe, and on the heels of strong gains over the past three months, we’ve felt that stocks were probably due for a moderate correction on the order of maybe 5 – 10%. But, they only fell a little over 4% from the recent highs reached on November 5th before popping right back up in the past couple of days.

The S&P is back to 1218, just 9 points from its November 5th high. The Dow and NASDAQ are similarly back close to their highs. But a little more under the surface, there have actually been an increasing number of breakouts to new highs among other indices and sectors. Indeed, small and mid-cap indices, and the energy, materials, industrials, and consumer discretionary sectors have all made new bull market highs in recent days. Considering that the character of those stocks tends to be more cyclical, we believe it sends a signal of a growing confidence in the economic recovery at this point. We’ll be watching closely to see if the Big 3 large-cap indices play catch-up and register their own breakouts. If that happens, it would be a very favorable development for the bulls.

Chart: Russell 2000 Index

Monday, November 29, 2010

The Average Depth of a Lake

The other day, I found myself writing a response to an op-ed in the Wall Street Journal written by Burton Malkiel from November 18th. If you don’t know, Malkiel is one of the most stalwart of the buy and hold crowd, and his article, called “Buy and Hold is Still a Winner,” pointed out the usual arguments for buy and hold investing. At one point in the article he observes that if you bought and held the S&P 500 Index from 1995 through 2009 you could have earned an average return of 8%, but if you missed the best thirty days of returns through poor market timing your return for the period would have been negative. The corollary to this statement is that if you measure a slightly longer period, from 1990 to 2008, and you miss the 30 worst days of performance, your return increases from 5.06% annually if you bought and held, to 14.5% annually! For the average stay-at-home investor, buying and holding and rebalancing is something that you can do. To take a crack at the 14.5% annual return you might want to retain the services of a professional advisor.

But that’s not the point of this blog. I’m fascinated with investor fixation on average returns. The average return for a time period is one of the most useless pieces of information I can imagine. Malkiel tells us that the buy and hold return from 1995 to 2009 is 8% on average. But what if you get to the average by earning 0% on your money for the first 7.5 years and then earning 16% on the next 7.5 years? If you are withdrawing money from your portfolio to fund your retirement, the results could be catastrophic. Your spending would decrease your capital to the point that you would possibly not have enough left to meet your objectives, even though your money was earning 16% per year for the second half of the time period. Financial planning research tells us that it isn’t the average of returns that matters. Instead, it is the order of returns that matters. Active and tactical portfolio management allow investors to defend against disorderly markets when they can least afford them.

Average portfolio returns are like the average depth of a lake. If I tell you the average depth is one foot deep and you can’t swim, are you going to try and walk across to a far shore that is a mile in the distance? Obviously the average depth is a useful piece of information for someone, but it isn’t relevant to the decision at hand. What if the path you take across the lake is actually 100 feet deep, even though the average is one foot? It would take a giant leap of faith to start walking across if you can’t swim. To focus on average returns for asset classes creates a similar problem. Without knowing why assets returned whatever they returned, the information is useful, but somewhat irrelevant. Investors hoping to earn the average returns of stocks should beware. The data strongly suggests that when buying at high normalized (or smoothed) P/E ratios, the odds of earning historical average returns are very low. Unfortunately, the 10-year normalized P/E ratio is about 22 times earnings currently. Buying and holding from here is like walking across that lake.

Wednesday, November 24, 2010

The Holiday Effect

Well, it is now 12:30 on Wednesday November, 24th. It is the day before Thanksgiving and very likely 90% of traders are at home anticipating one of the biggest party nights of the year. Total volume on the day is ¼ of the usual total volume on a regular trading day. And the S&P 500 is up 1.3%, or 15 points, on the day. Of course that makes total sense with the latest news out of Korea, the ongoing European struggles with insolvency, insider trading probes conducted at large hedge and mutual funds, etc…

Yesterday, the market was down on huge volume. Traders unloaded stock because they did not want to be long going into this holiday weekend due to all of the reasons mentioned above, and many more reasons unnamed. With the absentee level extremely high and a huge sell off yesterday, the few determined traders working could drive the market higher today creating a short-term trading opportunity. The market has gained back nearly the entire loss from yesterday!

This is a phenomenon called Pre- Holiday Trading, which has been documented in academic literature. In 1988, Lakonishok and Smidt (and many others after them) examined stock returns on trading days directly preceding holidays. They used 100 years of data and found a strong pattern of high stock returns the day before the nine stock exchange holidays. Short-term traders would purchase stock on the preceding day and sell the day following a holiday. There are also other trading strategies using holidays as an entry point including purchasing before Christmas and selling at year end. These strategies have shown very strong gains and are clear examples of seasonality.

We have written on seasonality in past blogs but I thought this was a very timely and clear example. Certain human behavioral patterns are present in the stock market including calendar behavior. At Pinnacle, behavioral study and cycle analysis is just a small part of the overall process. But perhaps knowledge of all investment theory will lead our own investment process to a much more profitable place in the future. We just have to remember to sell on Friday!

Monday, November 22, 2010

Dip Buying 101

Pinnacle Advisory Group is presently engaged in an investment practice known as “buying the dip.” Dip buying implies that you have a bullish stance towards whatever security that you are purchasing, and that you are using a short-term price decline to enter the position at more favorable prices. Dip buyers sometimes affect a somewhat self-important attitude in that buying dips implies a value conscious approach to investing, which is usually regarded as highly rational and professional. After all, only overly emotional “retail” investors purchase securities when they are making new highs, allowing the herd to stampede them into buying right at the top. It is the cool, calculated, value investors who have the steely nerve to let the market “come back to them” before purchasing. Any purchase price that is lower than the latest price high represents a victory for dip buyers, who steadfastly and with great conviction refuse to look too far in the rear view mirror for fear that they will find out that even though they bought a dip, they actually acquired the shares at a far higher price then they could have if they had simply joined the crowd and bought as the shares were breaking out to new highs.

Dip buyers live in fear of bloody fingers caused by trying to catch falling knives. This expression refers to the trend follower’s creed that falling prices beget more falling prices, and so buying into a falling market is like “trying to catch a falling knife.” When dip buyers pull the trigger and buy they are hoping that they are not buying into a sustained bear market where they are doubling down on positions that are fated to continue to lose money. While dip buyers are proudly and expertly buying as prices fall, in the privacy of their office they are stockpiling Band-Aids for bloody fingers and planning for their exit strategy if things don’t go as planned. Even worse, dip buyers often have a target price that the security must reach before they execute their purchases. As the market begins to fall you can feel the anxiety of the dip buyers begin to rise as they get nearer to their price targets. It’s like rooting for a horse in a close race. “Come on Rose Bud!” How horrible it is to see a security price turn around and begin to rise again just before it hits your price target.

Momentum investors think dip buyers have lost their marbles. They wonder why in the world anyone would try to buy a falling market just when the market is establishing a trend to the downside. Sheer lunacy they would say, and in some cases they are right. In this particular case our assessment is that the weight of the evidence suggests that we won’t have a double dip recession. If we are right then buying a dip is an excellent strategy for adding to risk assets without waiting for a trend to develop or reverse. At the moment we are fine tuning our asset allocation and making minor mid-course adjustments in portfolio construction. The past week or so has seen the broad markets sell-off almost exactly as we expected. Perhaps we will get to our price target in the next few days and complete our transaction (we chickened out and added 1% even though we were still a little short of our target). Rest assured, if the market trades down and through its 50-day moving average we will complete our planned transactions, but the entire investment team will make certain that our box of Band-Aids isn’t too far away.

Friday, November 19, 2010

Unusual Excitement in the Muni Market

Lately we’ve been watching municipal (muni) bond exchange traded funds (ETFs) fall at a rate that hasn’t happened since the Great Credit Crisis of 2008. Most of the available research is painting a picture of an almost perfect storm hitting the municipal market at the present time. Municipalities currently face: tough budgetary constraints due to revenue shortfalls, severely underfunded public pension funds, the possibility of an extension of the Bush tax cuts, a recent surge in new issuance, doubts about the future of the Build America Bond program, and a large municipal bond insurer filing for chapter 11 bankruptcy protection. In addition, some think this is a reaction to the Fed not buying a larger percentage of long-term bonds in its recently announced QE2 program. Whew, that’s a nasty witch’s brew for munis, which is reflected in the chart below.

With various muni ETFs down a quick 5-7% since the beginning of November, we are currently internally debating whether the decline is just a short-term dislocation that presents a buying opportunity, or a warning signal for the health of the overall market. At the moment, we are furiously digging through the research to make sure we have an informed opinion regarding this situation. My gut feeling is that this is an overshoot that will likely present a short-term window for investors to capitalize on. But many years in this business has taught me that investors ignore credit markets at their own peril, and so it’s worth double and triple checking before acting. Municipal bonds are typically thought of as boring investment vehicles for conservative investors. However, right now things are pretty exciting in the muni markets.

Chart: iShares Municipal Bond ETF (MUB)

Thursday, November 18, 2010

Bond Market Not Cooperating With QE2

Since November 2nd, the day before the Federal Reserve officially unveiled QE2 (consisting of $600 billion in new purchases of Treasury securities), the 10-year Treasury yield has climbed by 36 basis points, from 2.59% to 2.95%. Higher yields run counter to the Fed’s intentions, since they’ve specifically cited lower interest rates as one of the main reasons for implementing QE2. They believe that if they can drive rates even lower than they are now, it will help spur economic activity and support the recovery.

Although a 0.36% rise in rates may not seem that large, it’s already started to have an impact in the housing market. According to a weekly report from the Mortgage Bankers Association, 30-year mortgage rates rose from 4.28% to 4.46% last week, causing substantial declines in applications for both new purchases and refinancings (see the table below). Considering that the Fed is specifically trying to drive interest rates lower in order to help the housing market, they can’t be very pleased by the market’s reaction so far. It may just be a short-term phenomenon, or it could be a broader signal that the market doesn’t have much confidence in QE2’s ultimate effectiveness. The Fed is undoubtedly watching this very closely, and hoping that it’s the former, not the latter.

Wednesday, November 17, 2010

Boom Goes the Dynamite

The “Chinese Commodity Demand” theme, or the “Liquidity Driven Weak Dollar” theme, has been the investment theme driving the broad markets since the recent leg of the bull market took off in early July. We have written at length about this theme and it is amply expressed in Pinnacle’s current asset allocation. About 50% of our risk assets benefit from this theme one way or another, if you include diversified international funds, emerging markets, gold, commodities, energy, and industrials in the mix. On the one side we have the pundits who believe that growth in China and other emerging markets is propelling global economic growth, as seen most clearly in all assets related to the commodity complex. The other side claims that the U.S. Federal Reserve is on a clear mission to weaken the dollar versus foreign currencies which encourages asset inflation. They believe that the extra liquidity in the economy will find itself flowing to risk assets given that the banking system in the U.S. remains effectively broken. Pinnacle has one foot in each camp. In either case, our investments in the China demand theme or the liquidity weak dollar theme have supported portfolio performance for months.

However, we are most alert to the possibility that this theme can and will reverse at some point and when it does we expect that asset class correlations will remain high, meaning that U.S. stocks, international stocks, and commodities are going to get hit at the same time. And when they do, they are going to become very volatile. Last Friday was an interesting preview of why we have to remain careful about our weak dollar theme holdings. From November 4th through November 12th, the U.S. dollar index, as measured by the Powershares DB US$ Long Index (UUP) has gained +2.91% while during the same period the Currency Shares Euro Trust long Euro Index (FXE) has declined by -3.6%. The carnage has been predictable. On Friday our long-only Commodities Futures Index (UCI) got crushed, losing -5.2%. Our long-short commodity positions, Rydex and Direxion (RYLFX and DXCTX) were down by -3.21% and -3.81%, respectively. Since November 4th the long-only position is down -4.99% and DXCTX has lost -2.62% and RYLFX is down -2.92%.

Here are some other comparative stats since the dollar began rallying on November 4. The broad market (S&P 500 Index) is down -1.68%. Gold is -1.72%. Emerging markets are down -3%. U.S. Industrial Equal Weight ETF (RGI) is -2.06% The biggest surprises might be that energy related funds are doing well, with the broad based energy sector ETF (XLE) gaining +1.52% and the Oil and Gas Exploration ETF (XOP) gaining +3.29%. But if you are Ben Bernanke, Chairman of the U.S. Federal Reserve, and you are printing money like crazy with the expressed intention of lowering longer-term interest rates in the bond market, you must be very unhappy that since November 4th rates have risen and bond prices have fallen significantly. The 7-10 Year U.S Treasury ETF is down -1.93% and the 20-Year U.S. Treasury ETF is down -3.95%. BOOM! It’s highly probable that this reversal is temporary and reflects the overbought condition of these markets. Notably, Pinnacle portfolios perform with a fraction of the volatility of these securities. Nevertheless, we intend to buy this dip if it continues. However, like everything else in the current market environment, it requires our ongoing diligence.

Monday, November 15, 2010

Timing is Everything

Last week, the investment team met to discuss whether the events of the past few weeks, namely an important election, an announcement of additional quantitative easing by the Fed, and the recent close of the S&P 500 Index above its April high, means that we should change our investment stance. There has clearly been a change in the leading indexes that are so important in forecasting the economy's direction. Market-based indices like copper, broad-based commodities, and the Baltic Dry Index, as well as the Conference Board, ECRI, and the OECD, have all shown significant improvement. The stock market has reacted positively to the change in Fed policy from discussions about removing stimulus earlier this year, to keeping the current stimulus this summer, to the latest announcement that they are adding $600 billion of new stimulus. Key interest rate spreads that are early warning indicators of systematic market risk seem to be subdued, with the exception of the recent blow-out in PIIGS bond spreads. We are now into the 7th consecutive quarter of above-expected earnings growth where estimates have gone vertical for 2010 and estimates for 2011 are still staying steady at about $95 for the S&P 500. At an S&P price of 1,200 the P/E ratio for the market based on 2011 estimates is only 12.6 times earnings, hardly expensive in a zero interest rate environment.

There is a well-documented bearish case to be made, which we have explored in depth in this blog as well as our quarterly market reviews. The longer-term structural problems with the U.S. economy, and consequently the global economy, are frightening. But the shorter-term questions about the durability of the latest growth cycle remain in doubt as well. There seems to be little doubt that with the Republicans in control of the House of Representatives, investors shouldn’t count on fiscal stimulus to help the market going forward. And now that the Fed has committed to adding $600 billion to their balance sheet, there seems to be little chance of more monetary stimulus in the near future. So the question is where is the organic growth in the economy going to come from? The most popular answer seems to be that growth in the emerging markets will rescue the developed world from a dangerously slow growth scenario. Or perhaps the Fed’s prescription of zero interest rates and quantitative easing will do the trick. I remain a skeptic on both counts.

For now the team agrees that a minimum of benchmark levels of risk are appropriate across all of our investment policies, with the possibility that we could be more aggressive in our DA and DUA policies. The problem is that we are “running a little cool” in terms of risk assets at a time when the market looks very overbought on short-term sentiment measures. In short, investors are too bullish at the moment for us to feel comfortable adding to risk right now. The plan is to buy the dips, if we can get one or two before year-end. The tactics are sound, the plan seems to make sense, and we have high conviction in our assessment of the overbought condition of the market. Now all we need is for the market to cooperate and come back to us. A 5% correction from the recent high takes us right back to the 50-day moving average which is a great place to do a little nibbling. As always, timing is everything.

Friday, November 12, 2010

Changing Conditions = Changing Allocation, But With an Eye on Timing

Last week brought the mid-term elections, the highly anticipated and greatly hyped Federal Reserve QE2 meeting, and the latest look at employment. Has anything changed in our view? The answer is yes. At this point we feel that leading indicators of the economy are flashing signals that would imply a much smaller probability of a double dip recession, technical conditions in the market are quite strong, and valuation continues to putter along at a neutral level that gives it very little weight in our allocations.

With the amount of money being pumped into the system by the Fed, and the business cycle looking like it will avoid another contraction, we think there’s an increasing probability that the cyclical bull market in equities will have another leg up, bringing it closer to the upper end of the trading range that we believe we are navigating. From an allocation perspective, our latest thoughts translate to portfolios that should be at least neutrally invested, and a perhaps a hair over for those willing to take the higher than normal risks associated with this liquidity driven rally.

The only thing the team doesn’t like is the short-term overbought condition of the markets. Complacency has been building in recent weeks and it seems like we are due for a correction, which we may be in the midst of right now. At the moment our plan is to start scaling into equity positions if the S&P 500 pulls back to its 50-day moving average (currently around 1161), while keeping some in reserve in case the market breaks below that. Corrections are never fun, but in this case we are welcoming one, as it gives us a chance to align our portfolios closer with our latest thinking, and hopefully at cheaper and less complacent levels.

Wednesday, November 10, 2010

Pinnacle’s Tax Season

Most people view tax season as the time leading up to the April 15th tax date (well, April 18th for 2011). But here at Pinnacle, our tax season begins much earlier as we prepare portfolios for the end of the year. The Wealth Managers and I have been working for the past few weeks, and will continue to do so throughout the remainder of the year, analyzing gains and portfolio construction to ensure proper tax management.

There are a multitude of tax issues that we handle as we believe this is an important part of the process here at Pinnacle. We contact all mutual fund companies in which we invest to get an estimate on pass through gains. If the expected pass through gain is very large we stop making new purchases into the fund in the weeks leading up to the distribution. With the Great Recession a few years in the past, most mutual funds have losses to offset the gains but we have identified a few funds with modest distributions this year.

Then we review realized gains and loss statements for each client. The information we have available pertains to only accounts managed at Pinnacle. If a client has a large realized gain for the current year we will start the tax loss realization process. The investment team first identifies any security with a loss across the books, and then we finish with a client specific search for losses. For one month, due to the wash sale rule, we will purchase a proxy security with the expectation to switch back at the beginning of the New Year.

We can also search these reports for the past few years to see if there are carry-forward losses. If there is a large gains estimate for the current year, after accounting for carry forward losses, we will typically sell any current position with an unrealized loss (if there are any) to reduce the realized gain, assuming we can find a suitable proxy security to serve as a temporary replacement.

Additionally, if there are large carry forward losses from the past few years, as there may be due to the 2008 bear market, we will analyze the tax hierarchy of our model portfolios. Our tax hierarchy is built to rank the tax sensitivity of all securities owned in our models. The tax hierarchy is programmed into our portfolio trading software so that tax inefficient securities are bought in tax deferred accounts and tax efficient securities are bought in taxable accounts. We analyze the portfolios to see if there is any inconsistency between the tax hierarchy and portfolio construction (which can sometimes occur as we make changes to the models throughout the year), and sell securities in taxable accounts to re-purchase them in tax-deferred accounts, if it makes sense. When there are carry forward losses this is a much easier process because we can sell securities with gains.

Our tax process also deals with Required Minimum Distributions (RMDs). There are a few clients who receive monthly payments from their IRAs to satisfy the requirement but generally speaking the bulk of our clients wait until year end. We again analyze the tax hierarchy to sell the position inside the deferred account with the most beneficial tax treatment. We do this because the money distributed from the IRA is moved to the taxable account and we re-purchase the security back to keep the account on our managed model. If the distribution leaves the managed group we simply rebalance the portfolio taking into account the distribution.

I could go on, but I think I have given you a little insight into the tax planning that occurs at Pinnacle. I am sure to be busy over the remaining few weeks of 2010.

Tuesday, November 9, 2010

Taking Out the April High

The broad stock market indexes took out their April highs last week meaning that the bull market that began in March of 2009 is back in business. It has been more than 6 months since the S&P 500 Index hit its April high price of 1217 and then declined on fears that the problems in Greece and other “Club Med” members of the European Union might conspire to throw the U.S. economy, as well as the global economy, into a double dip recession. After finding a bottom on July 2 of this year, the market has rallied by 20% and due to the wonders of negative compounding, a 16% decline followed by a 20% rally gets us back to even. For those that might be wondering, bond investors fared much better from the April top to the current new S&P 500 high set last Friday. The Barclay’s Aggregate Bond Index gained 6.25% while stock investors just eeked out a 1.6% gain including dividends.

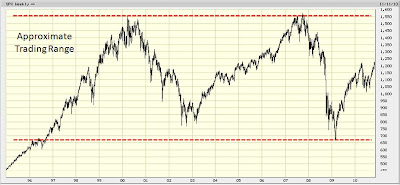
Of course bond investors have fared much worse on a relative basis since this cyclical bull market began in March of 2009. The S&P 500 Index including dividends has gained 87% while bonds have rallied by 15%. Finally, it is worth noting that stocks as measured by the S&P 500 Index are still trading 16% below the high set on 10/09/07 including dividends and 21% below the highs without dividends. Bond investors have earned a startling +24% over the same period. Investors are left to ponder what the next twist to this story might be. I have long argued that the S&P 500 Index is now trading in a gigantic range where the top is set at 1530 – 1540 (March of 2000 and October of 2007, respectively) and the bottom is 776 – 676 (October 2002 and March of 2009, respectively). If this is the case, then taking out this April’s high and closing at 1225 last Friday puts us 45% from the low and 25% from the high. It’s clear that the bulls have the upper the hand at the moment and while others will find intermediate points along the way for the market to find resistance to higher prices, the “granddaddy” of price resistance will be found above the 1500 level.

I’ve learned from painful experience that momentum can take financial markets far beyond what fundamental analysis might indicate is fair value. I wouldn’t be surprised at all if we make it all the way back to the top. The problem is that I haven’t been a believer in the underlying case for the bull market so far, and as long as residential real estate prices and massive unemployment continue to be a fact of our economic life, I will remain a skeptic. The Fed fired one of its last remaining bullets last week with a $600 billion plan to buy bonds with printed money, and the election basically ensures that there will be no more fiscal stimulus left to shore up the economy. The stock market is a leading indicator and the message for the past eighteen months is that the economy will expand and so will corporate profits. My ten cents worth is that it will be very hard to get overly bullish here, and that benchmark levels of risk would be just fine with me.

Friday, November 5, 2010

#1 Biggest Lesson

In honor of our eighth anniversary of posting GIPS compliant numbers for our investment strategies (GIPS compliance meets the highest industry standards for investment performance reporting), I asked our investment analysts to think about the three biggest lessons they have learned about investing over the past eight years. I am eagerly awaiting their answers. While I’m waiting for their response I’ve been thinking of the many lessons that I have learned as CIO of our growing investment business. Since I readily admit that we have been learning on the job for eight years, and fully intend to keep learning on the job for as long as we are in the business of active and tactical asset allocation, there have been lots of lessons learned and many more still to be learned in the future. Lately I’ve been thinking about one lesson that probably deserves to be at the top, or at least near the top, of the list.

The lesson is: High conviction forecasts are extremely rare, and the corollary to this lesson is, high conviction opinions by our investment analysts should be cherished. It is only in hindsight that movements in the economy and the investment markets seem obvious. In real time, we are buffeted with competing points of view about market direction from pundits and researchers who all seem to be the smartest guys (or gals) in the room. The data itself is often conflicting. Today emerging markets are either exhibiting all of the signs of an investment bubble, or they are reasonably priced and will outperform for years to come. Bond prices are in a bubble at record low interest rates, or they are reasonable priced to reflect the deflationary economic environment of the day. Stock prices are either cheap considering forward earnings and interest rates or they are expensive considering normalized or price to peak earnings. Earnings are either overstated based on unrealistically high assumptions of economic growth or they are understated based on the consensus and wrong assumption that we are in a “new normal” period of slow economic growth. It turns out that the answers to the questions about the facts of our economic and investment lives are always in doubt. It is in our clients’ interests to be cautious as we evaluate the answers to questions about market cycles, valuation, and market psychology, and getting to high conviction about any of the answers is indeed rare…and valuable.

The corollary statement, that high conviction opinions are to be cherished, is equally true. Our investment team thrives on spirited discussions about different viewpoints about the financial markets. The analyst who combines great knowledge with a passionate point of view is likely to win the day and persuade the rest of the team. Since we are responsible for managing $800 million in assets, taking the risk that your assessment could be wrong takes a great deal of ….well…..courage. Of course, that’s what we all get paid for. At the end of the day, I continue to believe that if you want to outperform a passive benchmark you must make investment forecasts. Since we don’t have a god-like ability to perfectly predict the future, we will make investment mistakes. The best we can do is assess the probability of future events and act based on our experience, judgment, and “right-brained” intuition. We will beat the benchmarks if we make fewer mistakes than the consensus of investors. Our business is only “easy” when we have high conviction in our forecasts. I guess that’s why no one ever said this was going to be easy.

Thursday, November 4, 2010

Good Sale – 6 Months Later?

We spend a considerable amount of time evaluating past trading decisions. Of course, with the benefit of hindsight, market moves seem obvious, but we try to keep things in context and remember what the events and circumstances that led us to execute a certain transaction were at the time. With that as a backdrop, I thought I’d go back to a bond trade from back in the spring.

The May 6th “flash crash” is almost six months old, and the panic of that day seems to have calmed. Every now and then we see additional flash crashes that occur in individual stocks but investors are generally unaware of these occurrences, or choose to ignore them. Market skepticism remains as retail investors continue to withdraw funds from the equity markets. But the S&P 500 has gained almost 7% since May 6th, and the international markets as measured by the MSCI EAFE Index have gained nearly 20% (or more using intra-day lows instead of closing prices). Additionally, the U.S. Treasury market has reversed course, with the 30 year Treasury bond down 8% since August as fear has left the market.

The reason I initially wanted to revisit that day was the trading activity that took place in our accounts as a result of the flash crash. As we watched the destruction ensue we decided to take advantage of the rapid rise in the iShares Barclays 20+ Treasury ETF (Symbol: TLT) and sell half of our position. TLT started the day around $94 per share and moved to $100 which was a move too strong to ignore. Or at least we thought so at the time, as over the next three months TLT rose to an August high of $109 per share. As I alluded to in the first paragraph, TLT has since dropped back down below $100 and is trading near the flash crash high point. Below is a chart of the TLT with the green line representing the flash crash high.

So the question remains, was this a good sale? We watched the TLT rally through August as we gnashed our teeth only to have the position give back all gains. I suppose to answer that question we need to know where bonds are going to trade. This could still turn out to be a good trade if the TLT continues to tumble and trades to 90, 80, 70, etc. Or the market could be giving us a chance to enter back into the TLT with this being a “no harm” trade for the last six months. With volatility and fear leaving the market we will have to discuss this option. Either way, I still feel this was a great trade, although this could be my “Portfolio Trader” bias shining through.

Tuesday, November 2, 2010

Eight Years Young

October marked the eight year anniversary of Pinnacle’s official GIPS compliant investment track record. It has been quite a journey. Eight years ago we were recovering from a traumatic bear market. Having “dodged a bullet” during the market decline because asset class correlations remained low and diversification did its work in limiting losses, we began to explore the possibility that buy and hold investing, known to us as strategic asset allocation, was not the best way to manage risk for Pinnacle clients. After a year and a half of discussions, we went ahead and restructured our entire investment business. Eight years later, I believe that we can claim more than our share of success in our effort to create an industry leading tactical and active portfolio management process.

In retrospect, I believe that our best insight in creating and implementing our new active strategy was the idea of creating volatility constraints for different Pinnacle investment strategies by using the back-tested results of strategically diversified (buy and hold) portfolios, which was not new. What was different was to allow the investment team to invest within the back-tested policy constraints for risk without any constraints in terms of what assets we could own for each risk strategy. By not targeting asset specific allocations for each portfolio policy we created an environment where Pinnacle analysts were free to recommend virtually any asset class for our portfolios as long as they met our definition of good value. Over time we’ve come to evaluate value in terms of traditional valuation, the market cycle, and market psychology or technical analysis. We utilize both quantitative and qualitative techniques to make investment decisions. We rely on what is now a very experienced team of analysts to apply the rules and make good decisions. And we continue to believe that we can win for our clients by not losing, both in terms of losing dollars due to bear market cycles, and losing in terms of making large and wrong asset allocation bets in the portfolio.

I think it’s fair to say that we couldn’t articulate much of the above eight years ago. We remind ourselves virtually every day that active management is a lifetime learning assignment. As long as we incorporate judgment and informed intuition into our decision making process, then we must defend against making investment mistakes. If we forget this lesson regarding lifetime learning, then we can count on the markets to remind us. We have learned that this is a humbling business that requires a brutal amount of hard work to be successful. It is too bad that our investment process simply does not allow us to fall into a lucky call that will be a “career” trade. The reason is, of course, that the implications of being wrong are too serious to make the big bet. That leaves us with trying to hit the singles and doubles necessary to gradually and systematically deliver outperformance on behalf of our clients. I’m looking forward to the next eight years.

Monday, November 1, 2010

A Very Positive Piece of Confirming Evidence

Friday brought a number of data points including third quarter GDP, the Chicago Purchasing Manager’s Index, and a few other odds and ends. And while those are worth dissecting as well, perhaps the most important piece of news came out of the Economic Cycle Research Institute (ECRI) on Thursday. We have been closely following the ECRI’s Weekly Leading Index (WLI) since the summer, when it ticked down to levels that have typically led business cycle contractions.

Over the last month or so the ECRI WLI has stabilized, and the director of ECRI had been saying that the next move in the index would prove to be critical in clarifying whether the current slowdown would degenerate into a contraction or not. At long last they have come down with the verdict, and have issued the following statement which can been found on their website (http://www.businesscycle.com/news/reports/1990): “That is the message from the leading business cycle indicators, which are unmistakably veering away from the recession track, following patterns seen in post-World War II slowdowns that didn’t lead to recession.” When combined with other leading indices that have already rebounded, like copper prices, the CRB spot price commodity index, and the Conference Board's Leading Economic Indicator, this is an important piece of confirming evidence that the cycle is stabilizing, even if it’s at a low level of growth.

What to do with this new piece of evidence, now that will be the topic of much discussion this week.

Friday, October 29, 2010

“What Deflation?”

One of the Federal Reserve’s primary justifications for next week’s expected second dose of quantitative easing (QE2) is that inflation is actually too low in the current environment. In effect, they are worried about deflation setting in, which history shows can be difficult to break free from. The latest readings of the Core (ex- food & energy) Consumer Price Index have usually been used to back this assertion up, since they’ve been less than 1% for several months. Therefore, it was very interesting to see embedded in this morning’s initial release of third quarter GDP that the GDP price index, at 2.3%, was the highest it’s been since the third quarter of 2008 – just before the Great Recession began. Over the past four quarters, the price index has steadily marched higher from -0.2%, to 1.0%, to 1.9%, to 2.3%.

In recent weeks, one of the analysts who we read daily, Bill King of The King Report, has highlighted numerous examples of increasing price pressures, from individual companies raising prices, to soaring commodity prices, to certain foreign central banks actually raising interest rates. In his trademark colorful style, he has typically preceded each example with the rhetorical question “what deflation?” as he questions what it is that the Fed is actually trying to accomplish with QE2. He’s certainly not alone in being skeptical, as it seems that there’s been a growing chorus of opinion that the Fed is headed down a slippery slope that will undoubtedly result in significant unintended consequences as they dramatically expand their balance sheet for a second time. While the details and effectiveness of QE2 remain to be seen, the trend in the GDP price index (among other things) certainly challenges the notion that inflation is too low.

GDP Price Index

Thursday, October 28, 2010

What the Fed Could Learn from Moms at Halloween

Today brought news that the Federal Reserve (Fed) is passing a survey around to its primary dealers (i.e., large Wall Street institutions). Get this one, it is asking them for a projection of central bank asset purchases (aka, “QE2”) over the next 6 months, as well as potential effects on market interest rates and possible impacts on growth going forward. I’m sorry, but I don’t get it. Just yesterday, a Wall Street Journal author who some believe is used to leak the Fed’s intentions, printed an article that implied the Fed would take a very measured approach to QE2 rather than a shock and awe-style round of buying. It seemed to be a strategic move by the Fed to reduce expectations that have built up in risk markets over the last few months. The worry is that if the Fed disappoints in terms of the size or scope of QE2 following its November 3rd meeting, perhaps the markets will sell the news, which could undermine the asset reflation that they are looking to foster.

So, what happens when you ask these dealers for their “projections?” They shoot for the moon, of course! Not surprisingly, I just read an article that said at least four of the primary dealers are predicting QE2 will entail over a trillion dollars in buying. Why the Fed would seemingly look to manage expectations down on one day, only to let these dealers undermine those expectations the next day, I have no idea. What I do know is this: this weekend is Halloween, and something tells me that no mom in America would ask her kids how many bags of candy she should be buying. Seems like common sense, but then again, who said our Federal Reserve would use such a thing when setting monetary policy? Happy Halloween, Ben Bernanke…

Tuesday, October 26, 2010

Gold Extension in Pinnacle Portfolios

Is gold in a bubble? There are a multitude of opinions on this topic, and of course, no one knows for sure if this is a bubble or not. Pinnacle feels that it is definitely a possibility although this bubble is more likely in the middle innings and 2011 could be another great year for the precious metal. However, over the last week or two, we had a decision to make as our rebalancing software suggested we take profits in the gold ETF owned in client accounts (GLD - the SPDR Gold Trust). Do we let the position stand and hope the outperformance continues, or do we trim the position and invest the proceeds in an underperforming position?

Our rebalancing program allows us to create models with designated weights. When the weight of the security exceeds our designated weight by 1%, the rebalancing tool suggests either a buy or sell of 1% to get back to our model weight. In this instance, GLD is currently a 5% model weight, and when the position falls to 4% or rises to 6%, the software will suggest a trade. After the vertical rise in gold to $1350 per ounce, portfolios weights in many accounts had moved to 6% and the program suggested we sell the position back down to 5%.

We decided to trim our GLD positions back to 5%. It feels like we may be approaching a short-term top as the market gets ever closer to next week’s Federal Reserve meeting. Momentum indicators have started to fall, sentiment is very optimistic, volatility has made a new low, etc. In the past, the rebalancing feature has alerted us to many overbought positions in client portfolios, and we feel gold may be due for a trend change (to a down trend or a flat trend) in the near term.

It is also interesting to note that the proceeds from the sale, for the most part, were used to purchase non-cyclical equity sector ETFs. It is interesting because risk assets usually get rebalanced into non-risk assets as the two seldom move together. This year has been an exception to the rule as U.S. Treasury bonds have risen along with risk assets. QE2 and POMOs are certainly wreaking havoc with correlations, and that is why the markets are anticipating the Fed meeting on November 3rd even more than usual.

Monday, October 25, 2010

“The Great Mandelbrot”

That is how Nassim Taleb described his first encounter with the work of Benoit Mandelbrot. My own encounter with his work occurred when I read his book, The (Mis) Behavior of Markets, A Fractal View of Risk, Ruin, and Reward. I was very saddened to learn last week that Mandelbrot died of cancer on October 14th in Cambridge, Massachusetts. He was 85 years old. I have little to no idea how mathematicians and economists are nominated for a Nobel Prize, and recent winners like Paul Krugman lead me to be skeptical about the process. If there is any justice, Mandelbrot will be accorded the honor of the Nobel, even if he made it clear in life that he didn’t exactly revere the prior winners.

Mandelbrot’s genius was his ability to see risk differently from everyone else, and then to be able to express it in a new kind of mathematics called fractal geometry. His book goes into great detail about fractals, but for the purposes of this blog I will simply say that they look beautiful. My key take away from Mandelbrot’s work was to better understand the problems with standard deviation as a measure of risk. Mandelbrot helps us to understand that risk is actually a lot “wilder” than standard deviation implies, and that the odds of “fat tail” occurrences are actually much higher than is generally understood. He gives us a new measure of risk called Power Laws where the odds of an event occurring do not geometrically increase as you get further from the average or the mean, which is exactly what happens when you measure risk using a bell curve. The insight that financial risk (which should be measured by Power Laws) is different from the deviation from the mean found in nature (which can be measured by bell curves and standard deviation) leads to powerful new conclusions about how to manage risk in portfolio management. Today the problems with “fat tails” are part of the lexicon of informed portfolio managers, and “fat tail” investment strategies designed to hedge these risks are approaching the mainstream. I believe Mandelbrot is the “founding father” of our new appreciation of risk as portfolio managers.

His book is coauthored by Richard L. Hudson, and I wonder who should get the credit for writing a book about so difficult a subject that is so easy to read. I often thought that I would have liked to sit in his classes at Yale where he taught since 1987 after a long career at IBM. My best tribute to Mandelbrot is to ask you to read his book, which I quote liberally in my book, Buy and Hold is Dead (Again), The Case for Active Management in Dangerous Markets. Chapter XII is one of my favorites, called Ten Heresies of Finance. Here they are: 1) Markets are Turbulent, 2) Markets are Very Very Risky- More Risky Than the Standard Theories Imagine, 3) Market “Timing” Matters Greatly. Big Gains and Losses Concentrate into Small Packages of Time. 4) Prices Often Leap, Not Glide. That Adds to the Risk. 5) In Markets, Time is Flexible, 6) Markets Will in All Places and Ages Work Alike, 7) Markets are Inherently Uncertain, and Bubbles Are Inevitable, 8) Markets Are Deceptive, 9) Forecasting Prices May Be Perilous, but You Can Estimate the Odds of Future Volatility, and 10) In Financial Markets, the Idea of “Value” Has Limited Value. I’m not on the Nobel committee, but I can recognize the passing of a giant when I see it.

Friday, October 22, 2010

What’s a POMO, and Why Does it Matter?

Lately there’s been a new acronym running through investment research we have been reading, and it is “POMO.” POMO stands for Permanent Open Market Operation. When you hear the Fed is executing a POMO for a certain amount, they are simply buying Treasury securities and the proceeds add reserves to the banking system permanently, as opposed to other temporary measures they may use. The Fed is entering into these transactions to ensure that its balance sheet doesn’t contract at a time when economic growth is still lagging, and price stability is at risk to lower prices.

For weeks the Fed has been using these POMOs, and we’ve been reading certain analysts that believe the market is reacting to the size of the daily POMOs. We recently asked one of the analysts we follow, Bill King, why he thought these POMOs mattered so much to the markets given the fact that the Fed is simply maintaining the size of the balance sheet. Below is a summarized version of Bill’s response to our question.

1. The Fed is entering into larger POMO’s than necessary to account for the bleed off of agency mortgage-backed securities. In his opinion, the first round of quantitative easing (QE1) never ended.

2. Money desks that control Wall Street must invest this new liquidity in the system, and at very highly leveraged multiples.

3. Traders respond reflexively to more juice equaling higher assets prices.

At Pinnacle Advisory Group, we can’t claim to know exactly how much POMOs are affecting daily movements in the market. But we can claim to constantly be evaluating and adjusting our views of financial markets based on new information and constantly changing conditions.

Tuesday, October 19, 2010

A Bullish Contrarian Bonanza

Lately I’ve been considering that fact that “informed intuition” about investment markets, the very stuff we hope to warehouse in large quantities at Pinnacle, can be tainted by any one analyst’s appetite for risk. We train ourselves to see bullish and bearish investment opportunities when they appear, and with training our goal is to see the world differently from the consensus. As someone who is not a big personal risk taker, I have to go out of my way to not let my personal predisposition to avoid risk color my ability to see bullish opportunities in the risk markets when they appear. And since one of the most tried and true methods of identifying risk taking opportunities is to be a contrarian and recognize that investment opportunity is often born of despair, I’m wondering if this isn’t the most bullish investment opportunity of all time. It looks pretty dark out there to me.

For example: We don’t manufacture things in the U.S. anymore. The profits remain here for large corporations but the jobs go overseas. Does anyone believe that we are better off? We have deficits everywhere, from fiscal deficits to trade deficits and now the Federal Reserve is running a “print up some dollars and buy all kinds of stuff” deficit of their own. It seems obvious to me that we can’t afford the social contracts that we’ve made in terms of pensions, social security, and health care, but no one has the courage or political will to do anything about it. I suppose we can blame our politicians but we really have the political system that we deserve. Most Americans don’t vote, and many of those that do are frighteningly uninformed about difficult and nuanced issues that defy “sound bite” explanations suitable for the evening news. Nowadays we pay attention to some kid writing a blog at 3PM at his parent’s house where he lives because he can’t get a job. We have 10% unemployment where the percentage of Americans who want to work but who can’t find jobs is frightening. Corporate earnings are up on the back of cost cutting (meaning layoffs) and government stimulus plans that we can’t afford. It appears that we are throwing the dice that all of these programs designed to thwart the next Great Depression by manufacturing either asset inflation or price inflation will work out well. Everyone knows we are on a high risk path for curing our national malaise but we all seem to be shouting at each other at such a volume that if there is a reasonable solution to be had, we just can’t seem to hear it.

We have a national foreclosure problem that is a disgrace and could lead to hundreds of billions of bank write-offs as well as another 10-20% decline in real estate prices. At the moment there ain’t no one interested in insuring titles to homes anymore because with the originate and distribute model for mortgages no one knows who actually owns the note on your home. The dollar is falling on the back of our unofficial national economic policy of debasing the currency, and “beggar thy neighbor” fiscal and monetary policies are breaking out around the globe. They say that every generation in U.S. history had a better standard of living than the one that preceded it, and every parent along the way worried that their kids wouldn’t do as well as they did. Well, I’m wondering about my kids and their kids. I’m afraid we are messing this up so bad that they won’t be able to continue the streak. So….the obvious conclusion is to back up the truck and buy stocks. If you are a contrarian, it’s hard to see how it can get much better (or worse) than this.

Thursday, October 14, 2010

Banks

We were tossing around a question yesterday regarding the current stock market rally from the July lows, and whether it can continue without the banks participating. The banks in this discussion are the big boys – JP Morgan, Citigroup, Bank of America, Wells Fargo, etc. The S&P 500 is up 15.5% from the July low (before today’s action which was a 4 point loss) while the banks, as measured by KBE (SPDR Bank ETF), were only up 4% from the July low (although down 2.5% today). Additionally, as you will notice in the chart below, the banks are still down over 19% from the April highs. The S&P 500 is the red line, which is approaching the April high after breaking through the June and August highs, and the KBE is the blue line, which has failed to make a new high!

Even so, at this time, the answer to our question is “yes.” The markets can and have rallied without the banks and it seems like they will continue to do so on the back of Federal Reserve stimulus. Consumer Staple stocks and Utility stocks have already surpassed the April high mark with Technology and Industrials hot on their trail. Material stocks are up 26% and Energy stocks are up 21% from the July lows. It is not only a rally but an incredibly strong one for many sectors and industries.

It seems this is just a bank specific issue at the moment as other financial industries like Capital Markets are fairing much better. Today, the cost of insurance for bank stocks is on the rise as indicated by rising Credit Default Swap levels. The fallout from faux-closure and a weak JP Morgan earnings report are causing investors to re-price risk in these stocks. All the while, investors in other stocks could care less.

But I can’t help but feel like it is 2007 all over again. The financials began selling off before any other sector in the market and we all know how that episode ended. Could MBS be the market’s downfall again?

Tuesday, October 12, 2010

On the Lookout for Asset Bubbles

QE2 is in the air, and lately the thought of it has certain markets all lathered up (or down). Risk assets have caught a bid on the dollar tanking. The inverse dollar trade has propelled returns in commodities and emerging market stocks, which have been rising fast on the back of a more highly liquid world and the belief that growth rates abroad can decouple from the sagging developed world.

The ultimate impact of a QE2 operation is very cloudy, and there are good reasons to be skeptical that it may not be the magic elixir to fix structural problems in our economy. But even if it doesn’t have an economic impact, the extra liquidity may find a home in asset prices, and perhaps even inflate another bubble or two.

Gold and emerging market equities are two asset classes that smell like they could have the makings of a bubble. Bubbles are awful when they burst, but fortunes are made for those that can find early developing bubbles, ride the major portion of the gains, and get out before they pop and wreak havoc on returns.

On the subject of QE2, we are skeptical that it can jump start the economy, but we are also aware that it may just be creating asset bubbles and manias in select sectors and asset classes. What inning are we in? Is it too late invest? Now that’s the making of an entirely different blog.

Monday, October 11, 2010

The Bullish Case

If you are feeling skeptical and concerned about the economy and the stock market, don’t worry. You have plenty of company…unless you are an institutional investor who is being whipsawed between bearishness and bullishness from month to month. You should know that if by the end of this missive you don’t believe the bullish case I’m making then most professional investors would say your view is bullish for equity markets, since bull markets “climb a wall of worry.” In this case, you are a “retail” worrier so your skepticism is as bullish as any bull could want. Please keep in mind that the following bullish case is made within a secular bear market, which means that the market will go up…until it comes down again as the secular bear market grinds on. Bulls think the market should move higher from here because basically….the fix is in.

The worst of the economic downturn is behind us. Leading economic indicators have rallied from their lows, and while some are flattening out, they still are greatly improved from the downturn in 2008. Double dip recessions are exceedingly rare, and there is no historical evidence that the economy should downshift in the face of massive additional monetary and fiscal stimulus. Make no mistake…if the recent lousy economic numbers continue the Fed will act with another $1 trillion or so of monetary stimulus. The bullish bet is that the additional money will either stimulate the economy and get the virtuous growth cycle kick-started resulting in higher employment, stabilized housing prices, higher capacity utilization, more bank lending, etc., which will result in higher stock prices. Or, the additional $1 trillion will do none of the above, but will find its way into the stock market nonetheless, driving stock prices higher. Bullish investors see this as either a virtuous return of price inflation or a non-virtuous return of asset inflation. Either way…happy days! By the way, the last cyclical bull in a secular bear lasted for exactly five years, from October of 2002 to October of 2007. It turned out that the entire bull market was built on smoke and mirrors, but who cares? By that measure we have at least another three years to enjoy the current cyclical bull.

The world is indeed different in the post-Lehman, flash crash, over-indebted place we now inhabit. It is the emerging markets of China, India, and Brazil that will lead the global economy out of recession. Unlike the U.S., Japan, and Europe, where the sovereigns essentially brought nothing but bogus debt onto their balance sheets, the balance sheets of the emerging countries look pristine. For that matter, on a relative basis, so do the balance sheets of blue chip U.S. companies that earn a large percentage of their profits overseas. Bonds might be horribly overvalued…you can currently lend the U.S. government money for 10 years at 2.4% interest. The Fed has pegged the Fed Funds rate at 0%! Cash pays nothing. So liquidity is flowing to emerging markets and commodities. Once we get a few more months of higher U.S. equity prices, then you, dear reader, will be clamoring for more U.S. stocks as well. Corporate earnings have been booming as productivity growth continues to surprise to the upside. So, the market is cheap and is likely to go higher. We are entering the most bullish seasonal time of the year and seem to be dodging the September-October blues. And the third year of presidential terms has a great track record for bullish stock market results. So there you have it....I told you you wouldn’t believe me!

Friday, October 8, 2010

Nothing Else Matters

I have had this old Metallica song, with slightly different lyrics, in my head for the past month…

Yeah, trust I seek and I find in you

Every day for us more QE2

Close your mind to a different view

Because nothing else matters

So is it really that easy? Our friends at TEAMThink posted a video from David Tepper in which he argues that it is just that easy. David Tepper is one of the best hedge fund managers of the past decade. According to Mr. Tepper, in scenario 1 you have strong growth and equities rally due to better underlying fundamentals. In scenario 2, you have weak growth but a Federal Reserve “put” will be in play in which everything, including equities, will go up, at least in the short term, because Quantitative Easing 2 (QE2) will be instituted. It is “a slam dunk trade due to the policies of the Federal Reserve.” I believe the other quote ringing in my ears is “Don’t Fight the Fed!”

But are those the only possible scenarios? Well, it seems that the market’s been using that playbook since July 1st when the S&P 500 bottomed at 1040. The S&P 500 is up 11% from that date while high beta assets have surged even more. After that run, it is natural to start questioning your underlying thesis that we should remain cautiously invested as the underlying fundamentals have remained soft. So what if the jobs market is still soft, it will get better or it will get worse but equities will rise. These are questions we have been asking ourselves.

Then again, there are other questions to ask. What if the market has already priced in a $1.5 trillion quantitative easing program but the Federal Reserve only gives us $750 million (or less)? What if Republicans gain Congressional seats and want to conduct a full audit of the Federal Reserve? What if QE2 destroys the dollar and equities rise only in nominal terms? What if currency wars erupt? What if High Frequency Signing manifests into a bigger problem as the real estate market shuts down? Bernanke? Anyone?

Thursday, October 7, 2010

October Thoughts about Seasonality

Market seasonality has probably been more of a factor in our decision making of late than it should. Rick wrote about it in this space last week. To make that statement in a year where “Sell in May and go away” has proven to be a perfect timing indicator might seem a little harsh. In fact, many of the analysts we follow publish composites of past market performance based on a variety of time frames, and those composites, along with the more traditional seasonal themes like “the January effect” or “summer rallies” are always a factor in our decision making process. Of course the market still has not managed to take out the late April high from this year so “sell in May,” with perfect hindsight, was excellent advice. However, the past few months have been dominated by our seasonal concerns about September and October. September is, on average, the worst performance month of the year for the broad market, and October is well known for having more than its share of well documented market meltdowns and investor riots. Now that we’ve just closed out September with the best performance for the month since the Great Depression, a disturbing result for “seasonality gurus,” we’ve spent some time digging further into the subject of seasonality as it pertains to third-year presidential cycles.

Ned Davis Research gives us some excellent data that seems immediately relevant. Consider the following information:

The DJI (Dow Jones Industrial Average) has gained, on average, 6.4% in 9 cases where there has been a change in the Congress in the third year of a presidency. The DJI has gained on average 6.4% in the 13 cases of a third-year presidential cycle within a secular bear market. The DJI has gained 6.1% on average in the thirteen cases in the year of a capital gains tax hike, and the DJI has lost 3.6% on average in 18 cases where the market was 22-34 months after a cyclical bull market within a secular bear market.

For the most part the data seems benign except of course for the 3.6% loss 22-34 months after a cyclical bull within a secular bear. Since the current bull market began in March of 2009 that seems to increase the likelihood that 2011 would be a poor year for the market. Of course, the 6%+ gains in the other data seem to indicate a decent year might be forthcoming. Ned Davis’s market cycle composite indicates that the broad market should be rolling over right now and testing new lows before it finishes the year with a strong rally. The question is how much weight to give any of this past seasonal information? It has little to do with the market fundamentals and technicals we track so religiously. Additionally, it has nothing to do with the current global economic condition and it doesn’t speak to current market valuations. Yet, it is seductive in its premise that the past could repeat. Considering that we are experiencing a financial condition that is unprecedented – a Great Reflation following a Great Recession – market seasonality and past market cycle composites will remain a part of our process….but not overly so.