Monday, November 29, 2010

The Average Depth of a Lake

The other day, I found myself writing a response to an op-ed in the Wall Street Journal written by Burton Malkiel from November 18th. If you don’t know, Malkiel is one of the most stalwart of the buy and hold crowd, and his article, called “Buy and Hold is Still a Winner,” pointed out the usual arguments for buy and hold investing. At one point in the article he observes that if you bought and held the S&P 500 Index from 1995 through 2009 you could have earned an average return of 8%, but if you missed the best thirty days of returns through poor market timing your return for the period would have been negative. The corollary to this statement is that if you measure a slightly longer period, from 1990 to 2008, and you miss the 30 worst days of performance, your return increases from 5.06% annually if you bought and held, to 14.5% annually! For the average stay-at-home investor, buying and holding and rebalancing is something that you can do. To take a crack at the 14.5% annual return you might want to retain the services of a professional advisor.

But that’s not the point of this blog. I’m fascinated with investor fixation on average returns. The average return for a time period is one of the most useless pieces of information I can imagine. Malkiel tells us that the buy and hold return from 1995 to 2009 is 8% on average. But what if you get to the average by earning 0% on your money for the first 7.5 years and then earning 16% on the next 7.5 years? If you are withdrawing money from your portfolio to fund your retirement, the results could be catastrophic. Your spending would decrease your capital to the point that you would possibly not have enough left to meet your objectives, even though your money was earning 16% per year for the second half of the time period. Financial planning research tells us that it isn’t the average of returns that matters. Instead, it is the order of returns that matters. Active and tactical portfolio management allow investors to defend against disorderly markets when they can least afford them.

Average portfolio returns are like the average depth of a lake. If I tell you the average depth is one foot deep and you can’t swim, are you going to try and walk across to a far shore that is a mile in the distance? Obviously the average depth is a useful piece of information for someone, but it isn’t relevant to the decision at hand. What if the path you take across the lake is actually 100 feet deep, even though the average is one foot? It would take a giant leap of faith to start walking across if you can’t swim. To focus on average returns for asset classes creates a similar problem. Without knowing why assets returned whatever they returned, the information is useful, but somewhat irrelevant. Investors hoping to earn the average returns of stocks should beware. The data strongly suggests that when buying at high normalized (or smoothed) P/E ratios, the odds of earning historical average returns are very low. Unfortunately, the 10-year normalized P/E ratio is about 22 times earnings currently. Buying and holding from here is like walking across that lake.

Wednesday, November 24, 2010

The Holiday Effect

Well, it is now 12:30 on Wednesday November, 24th. It is the day before Thanksgiving and very likely 90% of traders are at home anticipating one of the biggest party nights of the year. Total volume on the day is ¼ of the usual total volume on a regular trading day. And the S&P 500 is up 1.3%, or 15 points, on the day. Of course that makes total sense with the latest news out of Korea, the ongoing European struggles with insolvency, insider trading probes conducted at large hedge and mutual funds, etc…

Yesterday, the market was down on huge volume. Traders unloaded stock because they did not want to be long going into this holiday weekend due to all of the reasons mentioned above, and many more reasons unnamed. With the absentee level extremely high and a huge sell off yesterday, the few determined traders working could drive the market higher today creating a short-term trading opportunity. The market has gained back nearly the entire loss from yesterday!

This is a phenomenon called Pre- Holiday Trading, which has been documented in academic literature. In 1988, Lakonishok and Smidt (and many others after them) examined stock returns on trading days directly preceding holidays. They used 100 years of data and found a strong pattern of high stock returns the day before the nine stock exchange holidays. Short-term traders would purchase stock on the preceding day and sell the day following a holiday. There are also other trading strategies using holidays as an entry point including purchasing before Christmas and selling at year end. These strategies have shown very strong gains and are clear examples of seasonality.

We have written on seasonality in past blogs but I thought this was a very timely and clear example. Certain human behavioral patterns are present in the stock market including calendar behavior. At Pinnacle, behavioral study and cycle analysis is just a small part of the overall process. But perhaps knowledge of all investment theory will lead our own investment process to a much more profitable place in the future. We just have to remember to sell on Friday!

Monday, November 22, 2010

Dip Buying 101

Pinnacle Advisory Group is presently engaged in an investment practice known as “buying the dip.” Dip buying implies that you have a bullish stance towards whatever security that you are purchasing, and that you are using a short-term price decline to enter the position at more favorable prices. Dip buyers sometimes affect a somewhat self-important attitude in that buying dips implies a value conscious approach to investing, which is usually regarded as highly rational and professional. After all, only overly emotional “retail” investors purchase securities when they are making new highs, allowing the herd to stampede them into buying right at the top. It is the cool, calculated, value investors who have the steely nerve to let the market “come back to them” before purchasing. Any purchase price that is lower than the latest price high represents a victory for dip buyers, who steadfastly and with great conviction refuse to look too far in the rear view mirror for fear that they will find out that even though they bought a dip, they actually acquired the shares at a far higher price then they could have if they had simply joined the crowd and bought as the shares were breaking out to new highs.

Dip buyers live in fear of bloody fingers caused by trying to catch falling knives. This expression refers to the trend follower’s creed that falling prices beget more falling prices, and so buying into a falling market is like “trying to catch a falling knife.” When dip buyers pull the trigger and buy they are hoping that they are not buying into a sustained bear market where they are doubling down on positions that are fated to continue to lose money. While dip buyers are proudly and expertly buying as prices fall, in the privacy of their office they are stockpiling Band-Aids for bloody fingers and planning for their exit strategy if things don’t go as planned. Even worse, dip buyers often have a target price that the security must reach before they execute their purchases. As the market begins to fall you can feel the anxiety of the dip buyers begin to rise as they get nearer to their price targets. It’s like rooting for a horse in a close race. “Come on Rose Bud!” How horrible it is to see a security price turn around and begin to rise again just before it hits your price target.

Momentum investors think dip buyers have lost their marbles. They wonder why in the world anyone would try to buy a falling market just when the market is establishing a trend to the downside. Sheer lunacy they would say, and in some cases they are right. In this particular case our assessment is that the weight of the evidence suggests that we won’t have a double dip recession. If we are right then buying a dip is an excellent strategy for adding to risk assets without waiting for a trend to develop or reverse. At the moment we are fine tuning our asset allocation and making minor mid-course adjustments in portfolio construction. The past week or so has seen the broad markets sell-off almost exactly as we expected. Perhaps we will get to our price target in the next few days and complete our transaction (we chickened out and added 1% even though we were still a little short of our target). Rest assured, if the market trades down and through its 50-day moving average we will complete our planned transactions, but the entire investment team will make certain that our box of Band-Aids isn’t too far away.

Friday, November 19, 2010

Unusual Excitement in the Muni Market

Lately we’ve been watching municipal (muni) bond exchange traded funds (ETFs) fall at a rate that hasn’t happened since the Great Credit Crisis of 2008. Most of the available research is painting a picture of an almost perfect storm hitting the municipal market at the present time. Municipalities currently face: tough budgetary constraints due to revenue shortfalls, severely underfunded public pension funds, the possibility of an extension of the Bush tax cuts, a recent surge in new issuance, doubts about the future of the Build America Bond program, and a large municipal bond insurer filing for chapter 11 bankruptcy protection. In addition, some think this is a reaction to the Fed not buying a larger percentage of long-term bonds in its recently announced QE2 program. Whew, that’s a nasty witch’s brew for munis, which is reflected in the chart below.

With various muni ETFs down a quick 5-7% since the beginning of November, we are currently internally debating whether the decline is just a short-term dislocation that presents a buying opportunity, or a warning signal for the health of the overall market. At the moment, we are furiously digging through the research to make sure we have an informed opinion regarding this situation. My gut feeling is that this is an overshoot that will likely present a short-term window for investors to capitalize on. But many years in this business has taught me that investors ignore credit markets at their own peril, and so it’s worth double and triple checking before acting. Municipal bonds are typically thought of as boring investment vehicles for conservative investors. However, right now things are pretty exciting in the muni markets.

Chart: iShares Municipal Bond ETF (MUB)

Thursday, November 18, 2010

Bond Market Not Cooperating With QE2

Since November 2nd, the day before the Federal Reserve officially unveiled QE2 (consisting of $600 billion in new purchases of Treasury securities), the 10-year Treasury yield has climbed by 36 basis points, from 2.59% to 2.95%. Higher yields run counter to the Fed’s intentions, since they’ve specifically cited lower interest rates as one of the main reasons for implementing QE2. They believe that if they can drive rates even lower than they are now, it will help spur economic activity and support the recovery.

Although a 0.36% rise in rates may not seem that large, it’s already started to have an impact in the housing market. According to a weekly report from the Mortgage Bankers Association, 30-year mortgage rates rose from 4.28% to 4.46% last week, causing substantial declines in applications for both new purchases and refinancings (see the table below). Considering that the Fed is specifically trying to drive interest rates lower in order to help the housing market, they can’t be very pleased by the market’s reaction so far. It may just be a short-term phenomenon, or it could be a broader signal that the market doesn’t have much confidence in QE2’s ultimate effectiveness. The Fed is undoubtedly watching this very closely, and hoping that it’s the former, not the latter.

Wednesday, November 17, 2010

Boom Goes the Dynamite

The “Chinese Commodity Demand” theme, or the “Liquidity Driven Weak Dollar” theme, has been the investment theme driving the broad markets since the recent leg of the bull market took off in early July. We have written at length about this theme and it is amply expressed in Pinnacle’s current asset allocation. About 50% of our risk assets benefit from this theme one way or another, if you include diversified international funds, emerging markets, gold, commodities, energy, and industrials in the mix. On the one side we have the pundits who believe that growth in China and other emerging markets is propelling global economic growth, as seen most clearly in all assets related to the commodity complex. The other side claims that the U.S. Federal Reserve is on a clear mission to weaken the dollar versus foreign currencies which encourages asset inflation. They believe that the extra liquidity in the economy will find itself flowing to risk assets given that the banking system in the U.S. remains effectively broken. Pinnacle has one foot in each camp. In either case, our investments in the China demand theme or the liquidity weak dollar theme have supported portfolio performance for months.

However, we are most alert to the possibility that this theme can and will reverse at some point and when it does we expect that asset class correlations will remain high, meaning that U.S. stocks, international stocks, and commodities are going to get hit at the same time. And when they do, they are going to become very volatile. Last Friday was an interesting preview of why we have to remain careful about our weak dollar theme holdings. From November 4th through November 12th, the U.S. dollar index, as measured by the Powershares DB US$ Long Index (UUP) has gained +2.91% while during the same period the Currency Shares Euro Trust long Euro Index (FXE) has declined by -3.6%. The carnage has been predictable. On Friday our long-only Commodities Futures Index (UCI) got crushed, losing -5.2%. Our long-short commodity positions, Rydex and Direxion (RYLFX and DXCTX) were down by -3.21% and -3.81%, respectively. Since November 4th the long-only position is down -4.99% and DXCTX has lost -2.62% and RYLFX is down -2.92%.

Here are some other comparative stats since the dollar began rallying on November 4. The broad market (S&P 500 Index) is down -1.68%. Gold is -1.72%. Emerging markets are down -3%. U.S. Industrial Equal Weight ETF (RGI) is -2.06% The biggest surprises might be that energy related funds are doing well, with the broad based energy sector ETF (XLE) gaining +1.52% and the Oil and Gas Exploration ETF (XOP) gaining +3.29%. But if you are Ben Bernanke, Chairman of the U.S. Federal Reserve, and you are printing money like crazy with the expressed intention of lowering longer-term interest rates in the bond market, you must be very unhappy that since November 4th rates have risen and bond prices have fallen significantly. The 7-10 Year U.S Treasury ETF is down -1.93% and the 20-Year U.S. Treasury ETF is down -3.95%. BOOM! It’s highly probable that this reversal is temporary and reflects the overbought condition of these markets. Notably, Pinnacle portfolios perform with a fraction of the volatility of these securities. Nevertheless, we intend to buy this dip if it continues. However, like everything else in the current market environment, it requires our ongoing diligence.

Monday, November 15, 2010

Timing is Everything

Last week, the investment team met to discuss whether the events of the past few weeks, namely an important election, an announcement of additional quantitative easing by the Fed, and the recent close of the S&P 500 Index above its April high, means that we should change our investment stance. There has clearly been a change in the leading indexes that are so important in forecasting the economy's direction. Market-based indices like copper, broad-based commodities, and the Baltic Dry Index, as well as the Conference Board, ECRI, and the OECD, have all shown significant improvement. The stock market has reacted positively to the change in Fed policy from discussions about removing stimulus earlier this year, to keeping the current stimulus this summer, to the latest announcement that they are adding $600 billion of new stimulus. Key interest rate spreads that are early warning indicators of systematic market risk seem to be subdued, with the exception of the recent blow-out in PIIGS bond spreads. We are now into the 7th consecutive quarter of above-expected earnings growth where estimates have gone vertical for 2010 and estimates for 2011 are still staying steady at about $95 for the S&P 500. At an S&P price of 1,200 the P/E ratio for the market based on 2011 estimates is only 12.6 times earnings, hardly expensive in a zero interest rate environment.

There is a well-documented bearish case to be made, which we have explored in depth in this blog as well as our quarterly market reviews. The longer-term structural problems with the U.S. economy, and consequently the global economy, are frightening. But the shorter-term questions about the durability of the latest growth cycle remain in doubt as well. There seems to be little doubt that with the Republicans in control of the House of Representatives, investors shouldn’t count on fiscal stimulus to help the market going forward. And now that the Fed has committed to adding $600 billion to their balance sheet, there seems to be little chance of more monetary stimulus in the near future. So the question is where is the organic growth in the economy going to come from? The most popular answer seems to be that growth in the emerging markets will rescue the developed world from a dangerously slow growth scenario. Or perhaps the Fed’s prescription of zero interest rates and quantitative easing will do the trick. I remain a skeptic on both counts.

For now the team agrees that a minimum of benchmark levels of risk are appropriate across all of our investment policies, with the possibility that we could be more aggressive in our DA and DUA policies. The problem is that we are “running a little cool” in terms of risk assets at a time when the market looks very overbought on short-term sentiment measures. In short, investors are too bullish at the moment for us to feel comfortable adding to risk right now. The plan is to buy the dips, if we can get one or two before year-end. The tactics are sound, the plan seems to make sense, and we have high conviction in our assessment of the overbought condition of the market. Now all we need is for the market to cooperate and come back to us. A 5% correction from the recent high takes us right back to the 50-day moving average which is a great place to do a little nibbling. As always, timing is everything.

Friday, November 12, 2010

Changing Conditions = Changing Allocation, But With an Eye on Timing

Last week brought the mid-term elections, the highly anticipated and greatly hyped Federal Reserve QE2 meeting, and the latest look at employment. Has anything changed in our view? The answer is yes. At this point we feel that leading indicators of the economy are flashing signals that would imply a much smaller probability of a double dip recession, technical conditions in the market are quite strong, and valuation continues to putter along at a neutral level that gives it very little weight in our allocations.

With the amount of money being pumped into the system by the Fed, and the business cycle looking like it will avoid another contraction, we think there’s an increasing probability that the cyclical bull market in equities will have another leg up, bringing it closer to the upper end of the trading range that we believe we are navigating. From an allocation perspective, our latest thoughts translate to portfolios that should be at least neutrally invested, and a perhaps a hair over for those willing to take the higher than normal risks associated with this liquidity driven rally.

The only thing the team doesn’t like is the short-term overbought condition of the markets. Complacency has been building in recent weeks and it seems like we are due for a correction, which we may be in the midst of right now. At the moment our plan is to start scaling into equity positions if the S&P 500 pulls back to its 50-day moving average (currently around 1161), while keeping some in reserve in case the market breaks below that. Corrections are never fun, but in this case we are welcoming one, as it gives us a chance to align our portfolios closer with our latest thinking, and hopefully at cheaper and less complacent levels.

Wednesday, November 10, 2010

Pinnacle’s Tax Season

Most people view tax season as the time leading up to the April 15th tax date (well, April 18th for 2011). But here at Pinnacle, our tax season begins much earlier as we prepare portfolios for the end of the year. The Wealth Managers and I have been working for the past few weeks, and will continue to do so throughout the remainder of the year, analyzing gains and portfolio construction to ensure proper tax management.

There are a multitude of tax issues that we handle as we believe this is an important part of the process here at Pinnacle. We contact all mutual fund companies in which we invest to get an estimate on pass through gains. If the expected pass through gain is very large we stop making new purchases into the fund in the weeks leading up to the distribution. With the Great Recession a few years in the past, most mutual funds have losses to offset the gains but we have identified a few funds with modest distributions this year.

Then we review realized gains and loss statements for each client. The information we have available pertains to only accounts managed at Pinnacle. If a client has a large realized gain for the current year we will start the tax loss realization process. The investment team first identifies any security with a loss across the books, and then we finish with a client specific search for losses. For one month, due to the wash sale rule, we will purchase a proxy security with the expectation to switch back at the beginning of the New Year.

We can also search these reports for the past few years to see if there are carry-forward losses. If there is a large gains estimate for the current year, after accounting for carry forward losses, we will typically sell any current position with an unrealized loss (if there are any) to reduce the realized gain, assuming we can find a suitable proxy security to serve as a temporary replacement.

Additionally, if there are large carry forward losses from the past few years, as there may be due to the 2008 bear market, we will analyze the tax hierarchy of our model portfolios. Our tax hierarchy is built to rank the tax sensitivity of all securities owned in our models. The tax hierarchy is programmed into our portfolio trading software so that tax inefficient securities are bought in tax deferred accounts and tax efficient securities are bought in taxable accounts. We analyze the portfolios to see if there is any inconsistency between the tax hierarchy and portfolio construction (which can sometimes occur as we make changes to the models throughout the year), and sell securities in taxable accounts to re-purchase them in tax-deferred accounts, if it makes sense. When there are carry forward losses this is a much easier process because we can sell securities with gains.

Our tax process also deals with Required Minimum Distributions (RMDs). There are a few clients who receive monthly payments from their IRAs to satisfy the requirement but generally speaking the bulk of our clients wait until year end. We again analyze the tax hierarchy to sell the position inside the deferred account with the most beneficial tax treatment. We do this because the money distributed from the IRA is moved to the taxable account and we re-purchase the security back to keep the account on our managed model. If the distribution leaves the managed group we simply rebalance the portfolio taking into account the distribution.

I could go on, but I think I have given you a little insight into the tax planning that occurs at Pinnacle. I am sure to be busy over the remaining few weeks of 2010.

Tuesday, November 9, 2010

Taking Out the April High

The broad stock market indexes took out their April highs last week meaning that the bull market that began in March of 2009 is back in business. It has been more than 6 months since the S&P 500 Index hit its April high price of 1217 and then declined on fears that the problems in Greece and other “Club Med” members of the European Union might conspire to throw the U.S. economy, as well as the global economy, into a double dip recession. After finding a bottom on July 2 of this year, the market has rallied by 20% and due to the wonders of negative compounding, a 16% decline followed by a 20% rally gets us back to even. For those that might be wondering, bond investors fared much better from the April top to the current new S&P 500 high set last Friday. The Barclay’s Aggregate Bond Index gained 6.25% while stock investors just eeked out a 1.6% gain including dividends.

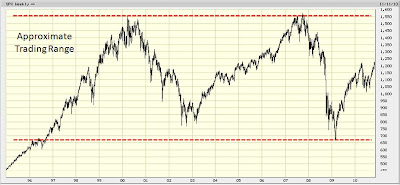
Of course bond investors have fared much worse on a relative basis since this cyclical bull market began in March of 2009. The S&P 500 Index including dividends has gained 87% while bonds have rallied by 15%. Finally, it is worth noting that stocks as measured by the S&P 500 Index are still trading 16% below the high set on 10/09/07 including dividends and 21% below the highs without dividends. Bond investors have earned a startling +24% over the same period. Investors are left to ponder what the next twist to this story might be. I have long argued that the S&P 500 Index is now trading in a gigantic range where the top is set at 1530 – 1540 (March of 2000 and October of 2007, respectively) and the bottom is 776 – 676 (October 2002 and March of 2009, respectively). If this is the case, then taking out this April’s high and closing at 1225 last Friday puts us 45% from the low and 25% from the high. It’s clear that the bulls have the upper the hand at the moment and while others will find intermediate points along the way for the market to find resistance to higher prices, the “granddaddy” of price resistance will be found above the 1500 level.

I’ve learned from painful experience that momentum can take financial markets far beyond what fundamental analysis might indicate is fair value. I wouldn’t be surprised at all if we make it all the way back to the top. The problem is that I haven’t been a believer in the underlying case for the bull market so far, and as long as residential real estate prices and massive unemployment continue to be a fact of our economic life, I will remain a skeptic. The Fed fired one of its last remaining bullets last week with a $600 billion plan to buy bonds with printed money, and the election basically ensures that there will be no more fiscal stimulus left to shore up the economy. The stock market is a leading indicator and the message for the past eighteen months is that the economy will expand and so will corporate profits. My ten cents worth is that it will be very hard to get overly bullish here, and that benchmark levels of risk would be just fine with me.

Friday, November 5, 2010

#1 Biggest Lesson

In honor of our eighth anniversary of posting GIPS compliant numbers for our investment strategies (GIPS compliance meets the highest industry standards for investment performance reporting), I asked our investment analysts to think about the three biggest lessons they have learned about investing over the past eight years. I am eagerly awaiting their answers. While I’m waiting for their response I’ve been thinking of the many lessons that I have learned as CIO of our growing investment business. Since I readily admit that we have been learning on the job for eight years, and fully intend to keep learning on the job for as long as we are in the business of active and tactical asset allocation, there have been lots of lessons learned and many more still to be learned in the future. Lately I’ve been thinking about one lesson that probably deserves to be at the top, or at least near the top, of the list.

The lesson is: High conviction forecasts are extremely rare, and the corollary to this lesson is, high conviction opinions by our investment analysts should be cherished. It is only in hindsight that movements in the economy and the investment markets seem obvious. In real time, we are buffeted with competing points of view about market direction from pundits and researchers who all seem to be the smartest guys (or gals) in the room. The data itself is often conflicting. Today emerging markets are either exhibiting all of the signs of an investment bubble, or they are reasonably priced and will outperform for years to come. Bond prices are in a bubble at record low interest rates, or they are reasonable priced to reflect the deflationary economic environment of the day. Stock prices are either cheap considering forward earnings and interest rates or they are expensive considering normalized or price to peak earnings. Earnings are either overstated based on unrealistically high assumptions of economic growth or they are understated based on the consensus and wrong assumption that we are in a “new normal” period of slow economic growth. It turns out that the answers to the questions about the facts of our economic and investment lives are always in doubt. It is in our clients’ interests to be cautious as we evaluate the answers to questions about market cycles, valuation, and market psychology, and getting to high conviction about any of the answers is indeed rare…and valuable.

The corollary statement, that high conviction opinions are to be cherished, is equally true. Our investment team thrives on spirited discussions about different viewpoints about the financial markets. The analyst who combines great knowledge with a passionate point of view is likely to win the day and persuade the rest of the team. Since we are responsible for managing $800 million in assets, taking the risk that your assessment could be wrong takes a great deal of ….well…..courage. Of course, that’s what we all get paid for. At the end of the day, I continue to believe that if you want to outperform a passive benchmark you must make investment forecasts. Since we don’t have a god-like ability to perfectly predict the future, we will make investment mistakes. The best we can do is assess the probability of future events and act based on our experience, judgment, and “right-brained” intuition. We will beat the benchmarks if we make fewer mistakes than the consensus of investors. Our business is only “easy” when we have high conviction in our forecasts. I guess that’s why no one ever said this was going to be easy.

Thursday, November 4, 2010

Good Sale – 6 Months Later?

We spend a considerable amount of time evaluating past trading decisions. Of course, with the benefit of hindsight, market moves seem obvious, but we try to keep things in context and remember what the events and circumstances that led us to execute a certain transaction were at the time. With that as a backdrop, I thought I’d go back to a bond trade from back in the spring.

The May 6th “flash crash” is almost six months old, and the panic of that day seems to have calmed. Every now and then we see additional flash crashes that occur in individual stocks but investors are generally unaware of these occurrences, or choose to ignore them. Market skepticism remains as retail investors continue to withdraw funds from the equity markets. But the S&P 500 has gained almost 7% since May 6th, and the international markets as measured by the MSCI EAFE Index have gained nearly 20% (or more using intra-day lows instead of closing prices). Additionally, the U.S. Treasury market has reversed course, with the 30 year Treasury bond down 8% since August as fear has left the market.

The reason I initially wanted to revisit that day was the trading activity that took place in our accounts as a result of the flash crash. As we watched the destruction ensue we decided to take advantage of the rapid rise in the iShares Barclays 20+ Treasury ETF (Symbol: TLT) and sell half of our position. TLT started the day around $94 per share and moved to $100 which was a move too strong to ignore. Or at least we thought so at the time, as over the next three months TLT rose to an August high of $109 per share. As I alluded to in the first paragraph, TLT has since dropped back down below $100 and is trading near the flash crash high point. Below is a chart of the TLT with the green line representing the flash crash high.

So the question remains, was this a good sale? We watched the TLT rally through August as we gnashed our teeth only to have the position give back all gains. I suppose to answer that question we need to know where bonds are going to trade. This could still turn out to be a good trade if the TLT continues to tumble and trades to 90, 80, 70, etc. Or the market could be giving us a chance to enter back into the TLT with this being a “no harm” trade for the last six months. With volatility and fear leaving the market we will have to discuss this option. Either way, I still feel this was a great trade, although this could be my “Portfolio Trader” bias shining through.

Tuesday, November 2, 2010

Eight Years Young

October marked the eight year anniversary of Pinnacle’s official GIPS compliant investment track record. It has been quite a journey. Eight years ago we were recovering from a traumatic bear market. Having “dodged a bullet” during the market decline because asset class correlations remained low and diversification did its work in limiting losses, we began to explore the possibility that buy and hold investing, known to us as strategic asset allocation, was not the best way to manage risk for Pinnacle clients. After a year and a half of discussions, we went ahead and restructured our entire investment business. Eight years later, I believe that we can claim more than our share of success in our effort to create an industry leading tactical and active portfolio management process.

In retrospect, I believe that our best insight in creating and implementing our new active strategy was the idea of creating volatility constraints for different Pinnacle investment strategies by using the back-tested results of strategically diversified (buy and hold) portfolios, which was not new. What was different was to allow the investment team to invest within the back-tested policy constraints for risk without any constraints in terms of what assets we could own for each risk strategy. By not targeting asset specific allocations for each portfolio policy we created an environment where Pinnacle analysts were free to recommend virtually any asset class for our portfolios as long as they met our definition of good value. Over time we’ve come to evaluate value in terms of traditional valuation, the market cycle, and market psychology or technical analysis. We utilize both quantitative and qualitative techniques to make investment decisions. We rely on what is now a very experienced team of analysts to apply the rules and make good decisions. And we continue to believe that we can win for our clients by not losing, both in terms of losing dollars due to bear market cycles, and losing in terms of making large and wrong asset allocation bets in the portfolio.

I think it’s fair to say that we couldn’t articulate much of the above eight years ago. We remind ourselves virtually every day that active management is a lifetime learning assignment. As long as we incorporate judgment and informed intuition into our decision making process, then we must defend against making investment mistakes. If we forget this lesson regarding lifetime learning, then we can count on the markets to remind us. We have learned that this is a humbling business that requires a brutal amount of hard work to be successful. It is too bad that our investment process simply does not allow us to fall into a lucky call that will be a “career” trade. The reason is, of course, that the implications of being wrong are too serious to make the big bet. That leaves us with trying to hit the singles and doubles necessary to gradually and systematically deliver outperformance on behalf of our clients. I’m looking forward to the next eight years.

Monday, November 1, 2010

A Very Positive Piece of Confirming Evidence

Friday brought a number of data points including third quarter GDP, the Chicago Purchasing Manager’s Index, and a few other odds and ends. And while those are worth dissecting as well, perhaps the most important piece of news came out of the Economic Cycle Research Institute (ECRI) on Thursday. We have been closely following the ECRI’s Weekly Leading Index (WLI) since the summer, when it ticked down to levels that have typically led business cycle contractions.

Over the last month or so the ECRI WLI has stabilized, and the director of ECRI had been saying that the next move in the index would prove to be critical in clarifying whether the current slowdown would degenerate into a contraction or not. At long last they have come down with the verdict, and have issued the following statement which can been found on their website (http://www.businesscycle.com/news/reports/1990): “That is the message from the leading business cycle indicators, which are unmistakably veering away from the recession track, following patterns seen in post-World War II slowdowns that didn’t lead to recession.” When combined with other leading indices that have already rebounded, like copper prices, the CRB spot price commodity index, and the Conference Board's Leading Economic Indicator, this is an important piece of confirming evidence that the cycle is stabilizing, even if it’s at a low level of growth.

What to do with this new piece of evidence, now that will be the topic of much discussion this week.