Friday, December 17, 2010

Divergence Developing in Volatility

At Pinnacle we tend to view volatility extremes as a contra-indicator for financial markets, with very low volatility associated with complacency and very high volatility associated with fear. Reaching such extremes can present very compelling investment opportunities at times. Currently, there is a big divergence in volatility measures between the stock and bond markets.

We are watching complacency build in equity markets as a measure of implied equity volatility (the VIX Index) has fallen near its low for the year, put/call options ratios are very low, and several surveys of investor bullishness or bearishness have grown exceedingly optimistic again.

The antithesis of the serene reading from the VIX can be seen in a measure of bond market volatility known as the MOVE Index. The MOVE Index is a measure of implied volatility in the Treasury market, and it has spiked to a new high for the year. This number also echoes recent bond surveys that imply that the short-term sentiment for bonds has turned in the opposite direction of stocks due to the wicked selloff in bonds, to deeply pessimistic levels.

Our sense is that the markets are setting up for a counter-trend rally that may feature a stock to bond rotation. The catch is that the counter-trend rally is not likely to end the bull market in stocks, nor is it likely to end the normalization of yields in the bond market. We are wrestling with what a counter-trend move might mean for portfolio allocations at this time.

Monday, December 13, 2010

Silly Season for Asset Allocation

I suppose it is that time of year for strategic, buy and hold, asset allocators to offer their best suggestions for the asset allocation that will, in their opinion, offer winning returns for the next decade. In a recent Wall Street Journal article, Burton Malkiel, one of the best known champions of passive investing, offered his suggestions in an article titled, “Buy and Hold is Still a Winner.” Malkiel proposes a portfolio that owns 33% fixed income, 27% U.S. equities, 28% international equities (one half of which is emerging markets) and 12% real estate trusts. Notably, Malkiel urges investors to own more international stocks as a percentage of their portfolio than U.S. stocks, an interesting thought process since international stock returns for U.S. investors are subject to significant currency risks.

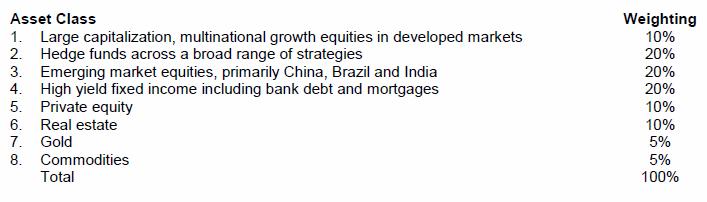
This month BlackRock shared Byron Wein’s views on asset allocation in their December Commentary. Wein’s piece was titled, “A Radical Approach to Asset Allocation.” Indeed it is. The following is Wein’s recommended asset allocation for U.S. investors:

Here the big news is that traditional large cap global growth stocks only comprise 10% of Wein’s portfolio. Alternative investments like hedge funds, private equity, real estate, gold, and commodities make up 50% of the total. Emerging market equity at 20% and high yield fixed income at 20% comprise the rest of the portfolio. Clearly Mr. Wein is not bullish on the prospects for global corporations to grow their earnings.

To me, these asset allocations are interesting but not necessarily relevant to the question at hand. I want to know what circumstances would cause either pundit to change their allocation. If stocks lose 50% of their value would Wein still only rebalance to 10% of his portfolio? If real estate trusts double in value would Professor Malkiel still own 12% in these securities? Both Malkiel and Wein offer portfolio allocations that are rather predictable in light of the past decade’s awful U.S. equity performance. They both look in the rearview mirror to come up with an allocation that is presumed to have meaning to intelligent investors regardless of the facts and circumstances of future market environments. As far as I’m concerned, these allocations are relevant until they are not. When the facts and circumstances of the global economy change, these allocations should be changed as well. That’s what we call tactical asset allocation.

Friday, December 10, 2010

Stealth Climb

With tax legislation on the horizon and unemployment concerns lingering, it seems the minds of Americans are preoccupied. In the past, crude oil would have been on everyone’s mind as it crosses above the $90 per barrel level. Now, it’s hardly mentioned in the main stream media and rightly so as the other issues deserve more attention. But it will be interesting to see just how far the price of oil has to move until the country starts to take notice again. When will this stealth rise be known?

In the first chart below is the price of oil. Since the market bottom in August it has climbed 21% to hit $90 per barrel. At that rate, we will hit $100 oil by February. The second chart is the price of a gallon of regular gasoline. That price has already broken the cyclical high, and stands above $3 per gallon. If we hit $100 per barrel on crude, we could easily see $3.35 per gallon at the pump. This would certainly hurt consumers’ pocketbooks; maybe even enough to have us take notice.

Additionally, other commodities have posted staggering gains this year. Cotton is up 80%, wheat is up 20%, and sugar is up 40% to name a few soft assets, while gold is up over 20%. This asset class has been the beneficiary of Quantitative Easing policies in Developed nations and strong growth in Emerging nations, and is starting to stoke inflationary fears. With the recent fiscal and monetary policies enacted by our leaders asset inflation is expected to continue. I guess it is good the tax extensions will pass (if not this year then next session of Congress) so we can pay for the commodity inflation. Although now is the time to take notice before this negative feedback continues.

Thursday, December 9, 2010

Secular Bear and Cynical Bull

I would usually use the term “cyclical bull” or “cautious bull,” but this week a client tagged me with a new moniker, a “cynical bull.” To be fair, lately I’ve been describing two different ways you could be bullish and one of them I describe as being cynically bullish. Let me explain. It seems to me that lately you could be a “virtuous bull” or a cynical bull. Virtuous bulls see the stock market in the context of an expanding economy. While there are obviously structural problems with the U.S. and the global economy, the fact is that we ARE in an economic recovery that began last June. Most economic recoveries are built on a wall of worry where trailing economic indicators, namely employment statistics, take awhile to confirm the economic expansion. To be a virtuous bull means that you are expecting the “virtuous economic cycle” to find some traction. The virtuous cycle is the classic economic expansion where growing corporate profits leads to greater consumer confidence. Higher confidence leads to higher spending. Higher spending leads to increased employment as companies must hire new workers to meet increasing demand. All of which leads to higher sales and higher profits…and so the cycle continues. Given that we are only 1 and ½ years into an economic recovery, virtuous bulls see nothing but several years of economic growth (even if it’s less than average growth) and higher stock prices ahead.

Cynical bulls are an entirely different breed. They see the financial markets as being “rigged” where policymakers and large financial institutions are desperately trying to avoid a financial catastrophe. In the cynical world, big banks in cahoots with Central Bankers and politicians around the globe are changing the rules to flood the world economy with enough money to touch off significant asset inflation. This is one of the traditional methods of dealing with a debt crisis. By allowing assets to inflate you can bring debt to equity ratios in line without the bothersome problem of paying off debt. Cynics find great joy in economic policy designed to prevent deflation at any cost and jump with glee as the Federal Reserve obviously manipulates the U.S. currency while claiming, with a straight face, that they are actually only interested in stimulating the economy and creating jobs. Asset inflations are wonderful opportunities to make money if you are a cynical bull since we believe our job is find asset inflations wherever we can find them and make lots of money by investing in them.

Of course the trick of riding an asset inflation bubble is 1) finding them closer to the beginning of the bubble than the top of the bubble, and 2) selling them before they burst. Cynical bulls don’t really care about the distinction between a virtuous cycle and a cycle that is induced by stimulus programs that will be paid for by the next generation…or the Chinese. We just care that getting too far out of the market when the candle gets lit and policymakers start spending the money is a risky thing to do if you want to be in a market with generally rising prices. This week’s drama in Washington where it looks like we get income tax extensions, estate tax cuts, payroll tax holidays, unemployment insurance extensions, credits for small businesses, and much, much more, is just music to the ears of a cynical bull. The game is still afoot and there is probably still more life in this bull market as long as the money-producing spigot is still open.

Tuesday, December 7, 2010

Fiscal Package A Catalyst, But For What Market?

Today the markets are buzzing on a tentative fiscal package that could extend the Bush tax cuts, emergency unemployment benefits, and even reduce social security taxes that come directly out of workers’ pockets. On the surface, this appears to be a fresh fiscal injection of liquidity that should act to bolster economic growth and has a chance to keep animal spirits focused on the bullish case for risk assets over a cyclical horizon.

The bad news is that the proposed package will cost almost $1 trillion, and it certainly flies in the face of a true concerted effort to reduce our country’s debt load. It wasn’t too long ago something called the deficit commission essentially concluded our nation is on an unsustainable fiscal path. Throughout 2010 we have also been witnessing a return of the global bond vigilantes. One of the lessons of this year might be that too much debt will ultimately force bond market adjustments, and those adjustments can ripple quickly through financial markets.

The proposed tax package is not a done deal, and Democrats are already voicing some major displeasure with the proposal. Assuming it gets passed without material changes, it seems destined to be a catalyst. But, will it be a positive catalyst for rising risk asset prices, or a negative one that causes a return of the U.S. bond vigilantes? That distinction could be the difference between another big leg up, or marginal new highs that succumb to a riot in the bond market.

Monday, December 6, 2010

Like Kissing Your Sister

Sometimes great minds think alike in the investment team, and I see that this blog overlaps the excellent piece on recent market performance that Carl posted on Friday. Nevertheless, here are a few additional thoughts on the topic.

The S&P 500 Index finished trading last Friday at a closing price of 1225. This is the same price the Index closed on 11/05/10, and it is +1.6% ahead of the close on 4/23/10, a period of close to eight months where stock investors have been disappointed. As I like to say, owning the broad market for the past eight months has been like “kissing your sister.” There just hasn’t been any thrill to being an equity investor when measured from the April market top. However, as Carl said last Friday, looking at the broad large-cap U.S. equity market doesn’t tell the whole story. For example, small-cap U.S. and mid-cap U.S. have both broken out to new highs as measured from the April peak (see chart on Carl’s blog). If you drill down into the S&P sectors and industries you find a number of fairly significant winners measured both from the April top and the November 5th top for the S&P 500 Index. Here are just a few sectors and industries that have performed well since April 23rd top and since 11/05/10. (Note: Pinnacle owns positions in all of these securities in various managed strategies.)

Gain Since 4/23/10

IGV Software ETF +13%

XOP Oil and Gas Exploration ETF +11%

IGN Networking ETF +7.1%

XLE Energy ETF +7%

XLY Consumer Discretionary ETF +5.6%

SPY S&P 500 Index ETF +1.6%

Lately we’ve been discussing the best strategy for buying this particular market. Should we view it suspiciously as the broad market has yet to convincingly break through important resistance that goes all the way back to late April? Or, should we be concentrating on individual sectors and industries that have already convincingly broken out to new highs and not worry about the broad market? Clearly tech, energy, and consumer stocks have resumed the bull market that began in March of 2009. In the past our investment process has focused on the broad market first. Presumably you could make the argument that waiting for the broad market to break out of its trading range is the more conservative methodology for risk averse investors. However, it may be that we have to switch gears here and begin to allow ourselves to invest more from the “bottom up,” meaning that we concentrate a little more on the sectors and industries. In a flat market like this, where gains might be fleeting, we may have to let the underlying sector performance guide our thinking more than it has in the past.

Friday, December 3, 2010

Breakouts

The stock market has had a very cheery start to December, which is typically the best month of the year. In just the first two trading days, the S&P 500 is already ahead by 3.5%. With all of the negative headlines swirling about the continuing debt problems in Europe, and on the heels of strong gains over the past three months, we’ve felt that stocks were probably due for a moderate correction on the order of maybe 5 – 10%. But, they only fell a little over 4% from the recent highs reached on November 5th before popping right back up in the past couple of days.

The S&P is back to 1218, just 9 points from its November 5th high. The Dow and NASDAQ are similarly back close to their highs. But a little more under the surface, there have actually been an increasing number of breakouts to new highs among other indices and sectors. Indeed, small and mid-cap indices, and the energy, materials, industrials, and consumer discretionary sectors have all made new bull market highs in recent days. Considering that the character of those stocks tends to be more cyclical, we believe it sends a signal of a growing confidence in the economic recovery at this point. We’ll be watching closely to see if the Big 3 large-cap indices play catch-up and register their own breakouts. If that happens, it would be a very favorable development for the bulls.

Chart: Russell 2000 Index