Wednesday, May 26, 2010

Bouncing, but for How Long?

The market finally bounced yesterday from a very oversold short-term condition, turning what was a 33 point loss on the S&P 500 Index at its worst point into a very slight gain for the day. So far today, it seems to be continuing, with the S&P up again as I’m writing this. The big question, of course, is how long this can potentially continue. Is this just a brief respite before we get a 2008-like plunge, or will the bull market of the past year resume from here?

It’s probably too early to tell at this point, but there will be some key things we’ll be watching to help us make that determination. First of all, the decline of the past few weeks has taken the market below some significant technical levels, so how it behaves as it now approaches these levels from below will be important. Second, to the extent this bounce is able to extend all the way back towards the April highs, we’ll be watching market internals for any notable divergences. Back in 2007, for instance, the S&P fell 9% in July and August before rallying back and making its ultimate high in October. But, there were some glaring divergences in measures like the advance/decline line, which failed to make a new high, giving a big clue that an important market top was forming.

In addition to market technicals, obviously we also need to keep a close watch on economic fundamentals to see if the recovery is still intact. Seemingly lost in all the concerns about the European debt crisis, rising geopolitical tensions around the globe, the oil spill, etc. is that recent economic reports have been largely positive. Yesterday, consumer confidence rose more than expected, while today both durable goods orders and new home sales surpassed expectations. Of course, there are plenty of things to be worried about and the market clearly seems to be focusing on those lately, but if the economy can withstand all of the current concerns and continue making progress, then maybe this will turn out to be just a nasty correction in a bull market.

Monday, May 24, 2010

A Special, Special Report?

This morning the investment team looked at 102 PowerPoint slides broken down into the categories of Spending and Wages (17 slides), Credit and Liquidity (34 slides), Employment (9 slides), Housing (9 slides), Leading Indicators (19 slides), Inflation (7 slides), and Commodity/Currency (7 slides). Not to bore you, but we then looked at another 20-plus technical slides showing market fear, mean regression, and a bunch of other technical indicators. Our goal was to see what, if anything, had changed in our outlook considering that we just wrote a Special Report to Pinnacle clients saying that we thought the recent European Union bailout plan for Greece might be the catalyst needed for the next, and possibly last, phase of the current bull market. Here is what we concluded:

Things have changed since we wrote our last report as the level of fear in financial markets has increased to levels not seen since the Lehman collapse. It is possible that investor fears about a Greek debt default have now morphed into investor fears that the entire European Union could unravel. This shock to growth has investors reconsidering risks to economic growth that were already well discounted in stock prices prior to the European crisis. Pinnacle is no exception, and this morning we reconsidered several well-known but relevant data points that could have an impact on our bullish view of economic growth going forward. Specifically we focused on 1) real wages remain soft and transfer payments are at historic highs relative to income, 2) small businesses cannot access credit and are pessimistic about future economic prospects, 3) mortgage delinquencies continue to be very high, 4) short-term views of risk spreads are elevated to levels that deserve our attention, 5) copper and oil, two of our leading economic data points, have sold off sharply over the past few weeks signaling something…or nothing.

Items 1 – 3 are not new but deserve a second look in light of recent events. Items 4 and 5 are new data that go into our economic forecast. The bottom line is that economic and credit risks are higher than they were and we are at an inflection point where we may pull some risk assets back off the table. We know that selling into elevated fear indexes is the “wrong” thing to do, and we would prefer to either hold what we have, or sell into a rally. At this point it is way too early to know if the global economic recovery is over and the financial markets are forecasting a double dip, or if global stock markets are simply having a well anticipated correction in a bull market. I would prefer it if the markets would find a bottom sometime soon so that we will not to have to provide our clients with a Special, Special Report about hedging portfolio risks. It is good to note that our portfolios continue to perform as expected on a relative and absolute return basis. Stay tuned…

Friday, May 21, 2010

Kicking the Can down the Road

I recall that as a kid I had great sport occasionally kicking a rock down the road. There were often rocks to be found along whatever route I was traveling and kicking the rock was a fun and relaxing way to pass the time, although I don’t have any idea why I would have been tense as a child, but that’s another matter altogether. I don’t recall often having the ability to actually kick a can down the road because in all probability there just weren’t that many cans lying around the road to be kicked. It seems to me that nowadays hardly anyone kicks cans down the road, mostly because we are all driving cars now and if you are a kid you are probably playing a video game on some handheld device while walking to wherever your destination happens to be.

“Kicking the can down the road” is especially relevant today because it is the newest overused term in the investment business. Occasionally the investment world gets fixated on a description of current events that spreads like wildfire and you hear it so many times that you just can’t stand it anymore. The most recent is “kick the can down the road” and the one prior to that was “the new normal,” a term given to us by Paul McCulley at PIMCO to describe the slower pace of growth we can expect from the global economy going forward. The term “kick the can down the road” is used to describe governments that refuse to address fiscal imbalances that are presumed to cause financial and social chaos in the future. A recent research piece by Joe Kalish, Senior Macro Strategist for Ned Davis Research, titled “Where We Stand on the European Sovereign Debt Crisis” comments on the Greek debt situation by saying, “By not rescheduling or restructuring the Greek debt, the Europeans have bought some time and ‘kicked the can down the road.’”

I saw several clients last week with my planning associate David Kauffman, who reminded clients in three separate meetings that we are “kicking the can down the road.” And many analysts who look at the deferred funding for the recent healthcare legislation feel that we are kicking the can down the road. Current U.S. debt to GDP ratios also imply some serious can-kicking. In fact, governments around the world are engaged in can-kicking most everywhere you look. If you happen to be out walking and see a can, give it a good kick. It will remind you of the simpler days of your childhood, or it will depress you as you consider our collective inability to live within our means. I find myself wondering whether democratic political systems can resolve can-kicking dilemmas without a serious financial crisis. Voters need to vote for a serious reduction in their standard of living and politicians need to try to get elected by offering a serious standard of living reduction to the voters. I’m skeptical that this will happen, to say the least. Ultimately the financial markets will riot and drastic measures will be enacted as we are seeing in Greece today. Until then, I guess we will just “kick the can down the road.”

Thursday, May 20, 2010

Fear Factor or Fundamental Change?

The market adjustment since late April has accelerated recently, taking the S&P 500 and other major equity market indices into negative territory for the year. One thing that’s obvious is that the mood of investors has made a sharp turn from complacency to outright fear. That can be seen in measures such as the VIX Index of implied options volatility as well as put/call ratios that are now jumping off the charts. From a sentiment standpoint, the kind of fear we are seeing now is typically a good sign as it indicates that weak hands are being shaken out of the market. I say typical, because if a debt contagion occurs in Europe then we might be headed for a replay of the crisis of 2008, where the exception becomes the rule. But outside of outright contagion, the return of fear should be compelling for seasoned investors to consider adding risk right here for at least a shorter term rebound, while suppressing the urge to join the rest of the sellers.

Unfortunately, those same indicators don’t really tell us much about whether the fundamentals of the world economy are changing or not. For that we go back to a long laundry list of economic data that we follow. On that front, the latest developments have been mixed. On the downside, some of the leading indices are taking a hit. Extremely economically sensitive commodities such as copper and oil are declining precipitously, measures of money supply have waned, and recently the Conference Board’s Index of Leading Economic Indicators fell from March to April, after twelve straight monthly gains.

However, there are other important data points that we follow that continue to look encouraging. Job growth has returned, where four consecutive months of gains provides hope for stronger wages and a new spending cycle. In addition, there’s renewed stimulus due to the Euro-zone bailout, lower bond yields in the U.S., lower energy prices, and a U.S. Federal Reserve that will likely stay on hold longer than previously anticipated. These forces, when taken together, are not trivial and will likely be discounted by markets as the fear subsides.

Events are moving quickly, markets are being adjusted at light speed, and one can easily be overwhelmed by the negativity of the moment. Our job is both simple yet intensely complex – to be able to separate the noise, evaluate the meaningful signals, and determine whether this market sell-off is based more on fear or a fundamental change in the landscape. Rest assured that is what we will be wrestling with in the days ahead.

Tuesday, May 18, 2010

Another Misguided Ban

You might recall during the height of fear in September 2008, the Securities Exchange Commission halted short selling of financial stocks in an attempt to protect investors and markets. They felt that the integrity of the markets was being questioned and this move would restore equilibrium to markets. You might also recall that financial stocks (as measured by the XLF – financial sector ETF) fell from $18.50 to $6 per share (a 67% decline) from September 2008 to March 2009. It is certainly evident in hindsight that excessive shorting was not the enemy of financial positions. But it’s nice to place blame elsewhere!

Now, it seems that Europe may be heading down the same path. Today, Germany’s financial markets regulator announced that it would ban naked short selling and naked credit default swaps on euro-zone debt, and ban short selling in 10 financial/insurance stocks through March 31, 2011. The reason given for the new rules, as you may have guessed, is that massive short selling has led to excessive price movements which could crash the entire financial system. And apparently they fear that crash could occur in one night, since the ban goes into effect at midnight local time.

It has been pointed out that this is merely a symbolic move by the German regulator because most naked short selling occurs in London which is outside their jurisdiction. However, it highlights the inability of European nations to face the real problem. In 2008 financial stocks were sold due to toxic assets littering their balance sheets, and now Euro bonds are being sold due to fiscal problems and excessive debt loads. And just as the financial stocks in the U.S. continued to fall after the short selling ban in 2008, the market will probably find a way to tell the European leaders that this type of action does not correct the underlying problem of fiscal mismanagement. The euro was down over 1.5% today so I think that message is already coming through.

Monday, May 17, 2010

Lies, Damn Lies, and Statistics

Today the major guru of a research firm that we routinely follow was making the point that the momentum of the market is important, but the quality of the momentum is also important. He then went on to look at several underlying data points to make the case that it was prudent to be cautious about the current cyclical bull market. One of the data points he shared was to compare the percentage gain and the length in days of the current bull market to past cyclical bull markets that occurred during secular bears. For those who are wondering, secular market cycles are very long-term market moves and cyclical moves are the shorter-term bull and bear markets that occur within the secular time frame. Most cyclical bull and bear markets are measured in terms of years rather than months. During the current secular bear market, which began in March of 2000, there have been four cyclical market moves. The first was March of 2000 to either October of 2002 or March of 2003 (depending on your preferences for measuring this kind of thing). The second was the bull market that lasted from the 2002-2003 market troughs and lasted through October of 2007. The third was the cyclical bear from October of 2007 to March of 2009. And the fourth is the current bull market that began in March of 2009 and has lasted to the current date.

If you look at the list of S&P 500 Index cyclical bull markets that occur within secular bears going back to the 1930s, you find that there are 16 different cyclical bull markets during secular bear markets. The percentage gain for these bull markets ranged from 21.2% to 123.3% and the number of days from bottom to top ranged from 61 to 1,826 (the latter was the cyclical bull from 10/09/2002 – 10/09/2007). Our guru points out that the percentage gain for the current bull market is 79.2%, which is greater than the mean and median percentage gains from prior periods, which were 62.3% and 51.2%, respectively. Similarly, the 413 days of the current bull is lower than the mean and higher than the median durations of prior cyclical bulls in secular bears, which were 465 days and 337 days, respectively. Today’s message was that the current bull market has gained more than the average cyclical bull (79% versus 62% mean or 51% median) and lasted longer than the median but less than the mean (413 days versus 465 mean and 337 median). In short, this bull has gained enough and lasted long enough to be cautious.

However, just a few weeks ago another analyst at the same company used similar data to reach the opposite conclusion. Using data for the Dow Jones Industrials (as opposed to the S&P 500 Index), he found that the statistics show that the DJIA’s gain of 71% ranks only 8 among the 16 cyclical bulls that have taken place within secular bears. The longevity ranks ninth. In short, just looking at the rankings as opposed to comparing to the means and medians of previous data leads to a completely different conclusion about the percentage gain and duration of the current cyclical bull. The rankings suggest that this bull market has a long way to go in comparison with bull markets within secular bears in the past. It’s another good reminder to think carefully about the data as it is presented to be certain that you understand the “spin” in the message.

Friday, May 14, 2010

What Could Change Our Stance?

Lately our communications have focused on the fact that we are still bullish over the intermediate term, and are using current volatility in the markets to augment risk assets in our portfolios. With that in mind, it is important to note that we are not complacent here, and realize that if conditions continue to deteriorate, there is a possibility that the dislocation in Europe could infect growth across the globe. As investors learned during the last downturn, countries are more interlinked than ever these days, and I certainly don’t think that any country can decouple should a major economic power begin to falter.

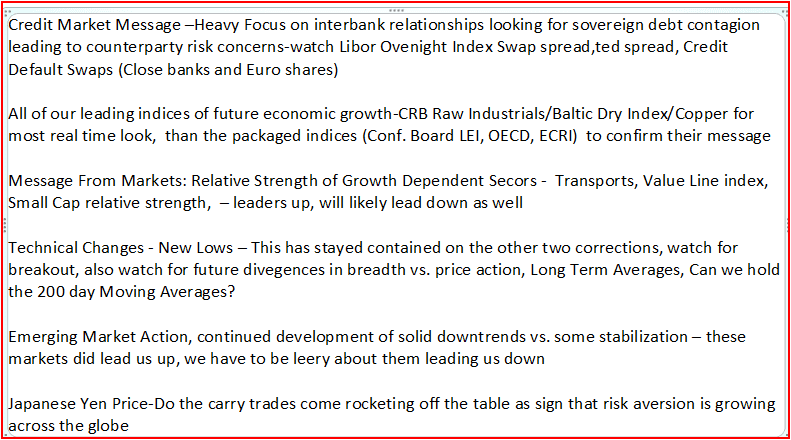
So I’m sure readers are wondering what sorts of data points we are watching that might factor into a change in stance. To make a change in our cyclical market view (as opposed to forecasting a correction within a bull market) it usually takes a wide cross section of data points (macro economic, technical, value, change in independent analyst views, etc). However, there are certain data points that we are focusing on very intently given current market conditions. The table below is a brief scratch list of some of the more important things that the team is watching closely right now.

For now, we continue to invest a bullish view based largely on continued economic expansion. But views can and do change, and we will continue to keep an open mind based on how the evidence builds in the many data points we follow. After a monster rally off the lows, and hitting the lower end of our target range, it is no time to be entrenched in any one view at this time.